Polishing a time tracker
Polishing a time tracker
Polishing a time tracker
Used as a metric to improve velocity and review a ticket's complexity in an Agile environment.
Used as a metric to improve velocity and review a ticket's complexity in an Agile environment.
Used as a metric to improve velocity and review a ticket's complexity in an Agile environment.
Role
Role
Product Designer at Density Labs
Product Designer at
Density Labs
Product Designer at
Density Labs
Duration
Duration
4 Weeks
4 Weeks
Tools
Figma
Jira
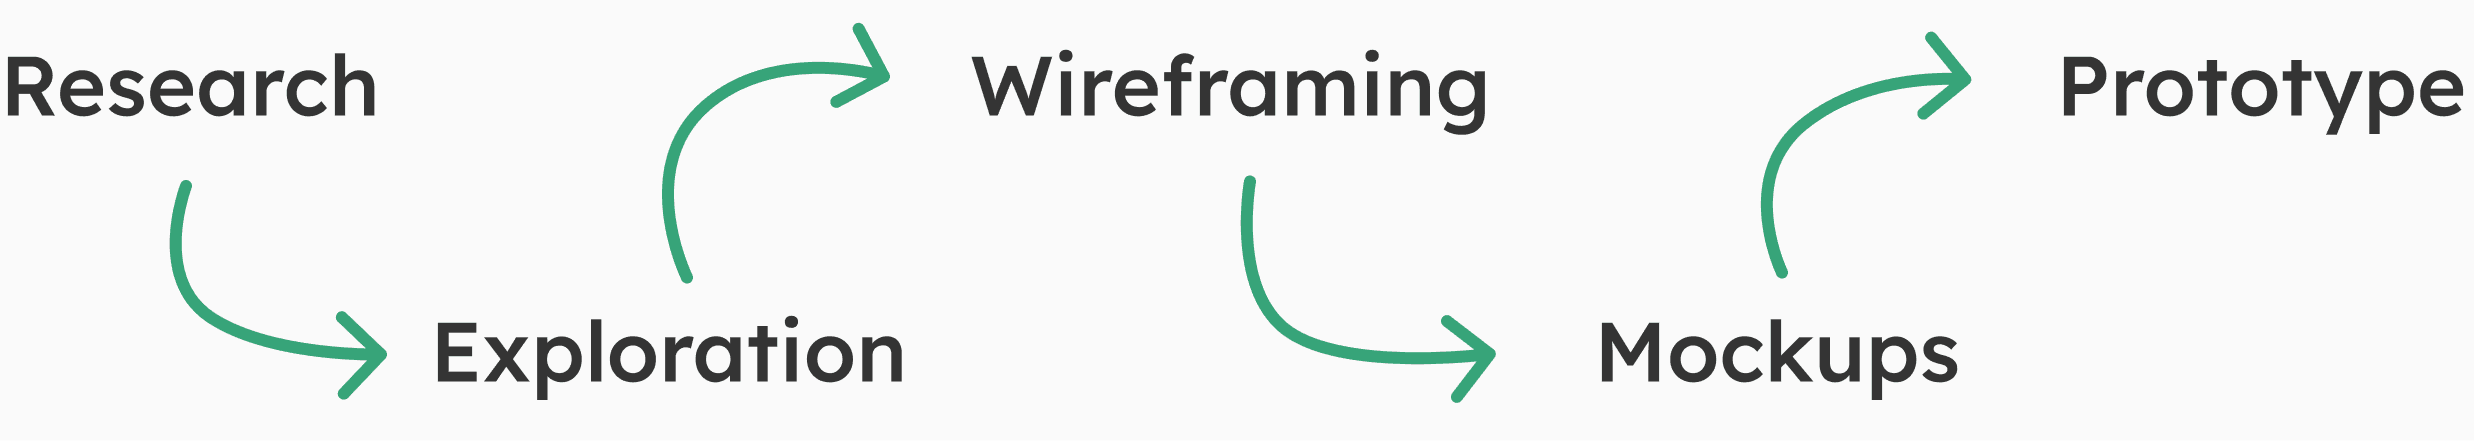
Design process
Research
Interviewing
Personas
Wireframing
Mockups
Tools
Tools
Figma
Jira
Figma
Jira
Design process
Design process
Research
Interviewing
Personas
Wireframing
Mockups
Research
Interviewing
Personas
Wireframing
Mockups
Introduction
Introduction
Introduction
The task of this project was to redesign the time tracker used by Density Labs to track the progress of their employees during their first months working in the company.
The project was also part of an internship program to develop and refine UX and UI skills and practices.
The task of this project was to redesign the time tracker used by Density Labs to track the progress of their employees during their first months working in the company.
The project was also part of an internship program to develop and refine UX and UI skills and practices.
Research
Research
Research
My first task was to research on multiple areas, from the previous design to possible competitors.
I reviewed what all of them had before coming up with possible ideas regarding the new design’s structure.
My first task was to research on multiple areas, from the previous design to possible competitors.
I reviewed what all of them had before coming up with possible ideas regarding the new design’s structure.
Timer
Timer
Timer
Timeline
Timeline
Timeline
Dashboard
Dashboard
Dashboard
Entries
Entries
Entries
Competitors
Competitors
Competitors
Toggl: Their combination of the timer with the timetable is smart and its color usage helps to identify certain tasks that were handled at certain times. Editing entries can be confusing. Its hierarchy and color contrast are also useful to identify more important elements in the website.
Clockify: They separate the timer and timetable like Cronus and unlike Toggl. The timer’s hierarchy and contrast is easily visible and helps to know quickly the timeframe for certain tasks, but the design in general looks a bit outdated. The dashboard and entries are also easily understandable to know how much time was spent in certain situations.
Chronos: They handle things very differently than other apps. They don’t have a calendar view, all they have are project cards where you start or edit your entry and then you can see on the card the amount of time spent on each area. It’s not as intuitive as the other apps and shows very little information for the user to work with.
Exploration
Exploration
Exploration
At this part of the process, I started to explore and gather content that I would need before structuring the design. These would be the personas, colors, and typography.
At this part of the process, I started to explore and gather content that I would need before structuring the design. These would be the personas, colors, and typography.
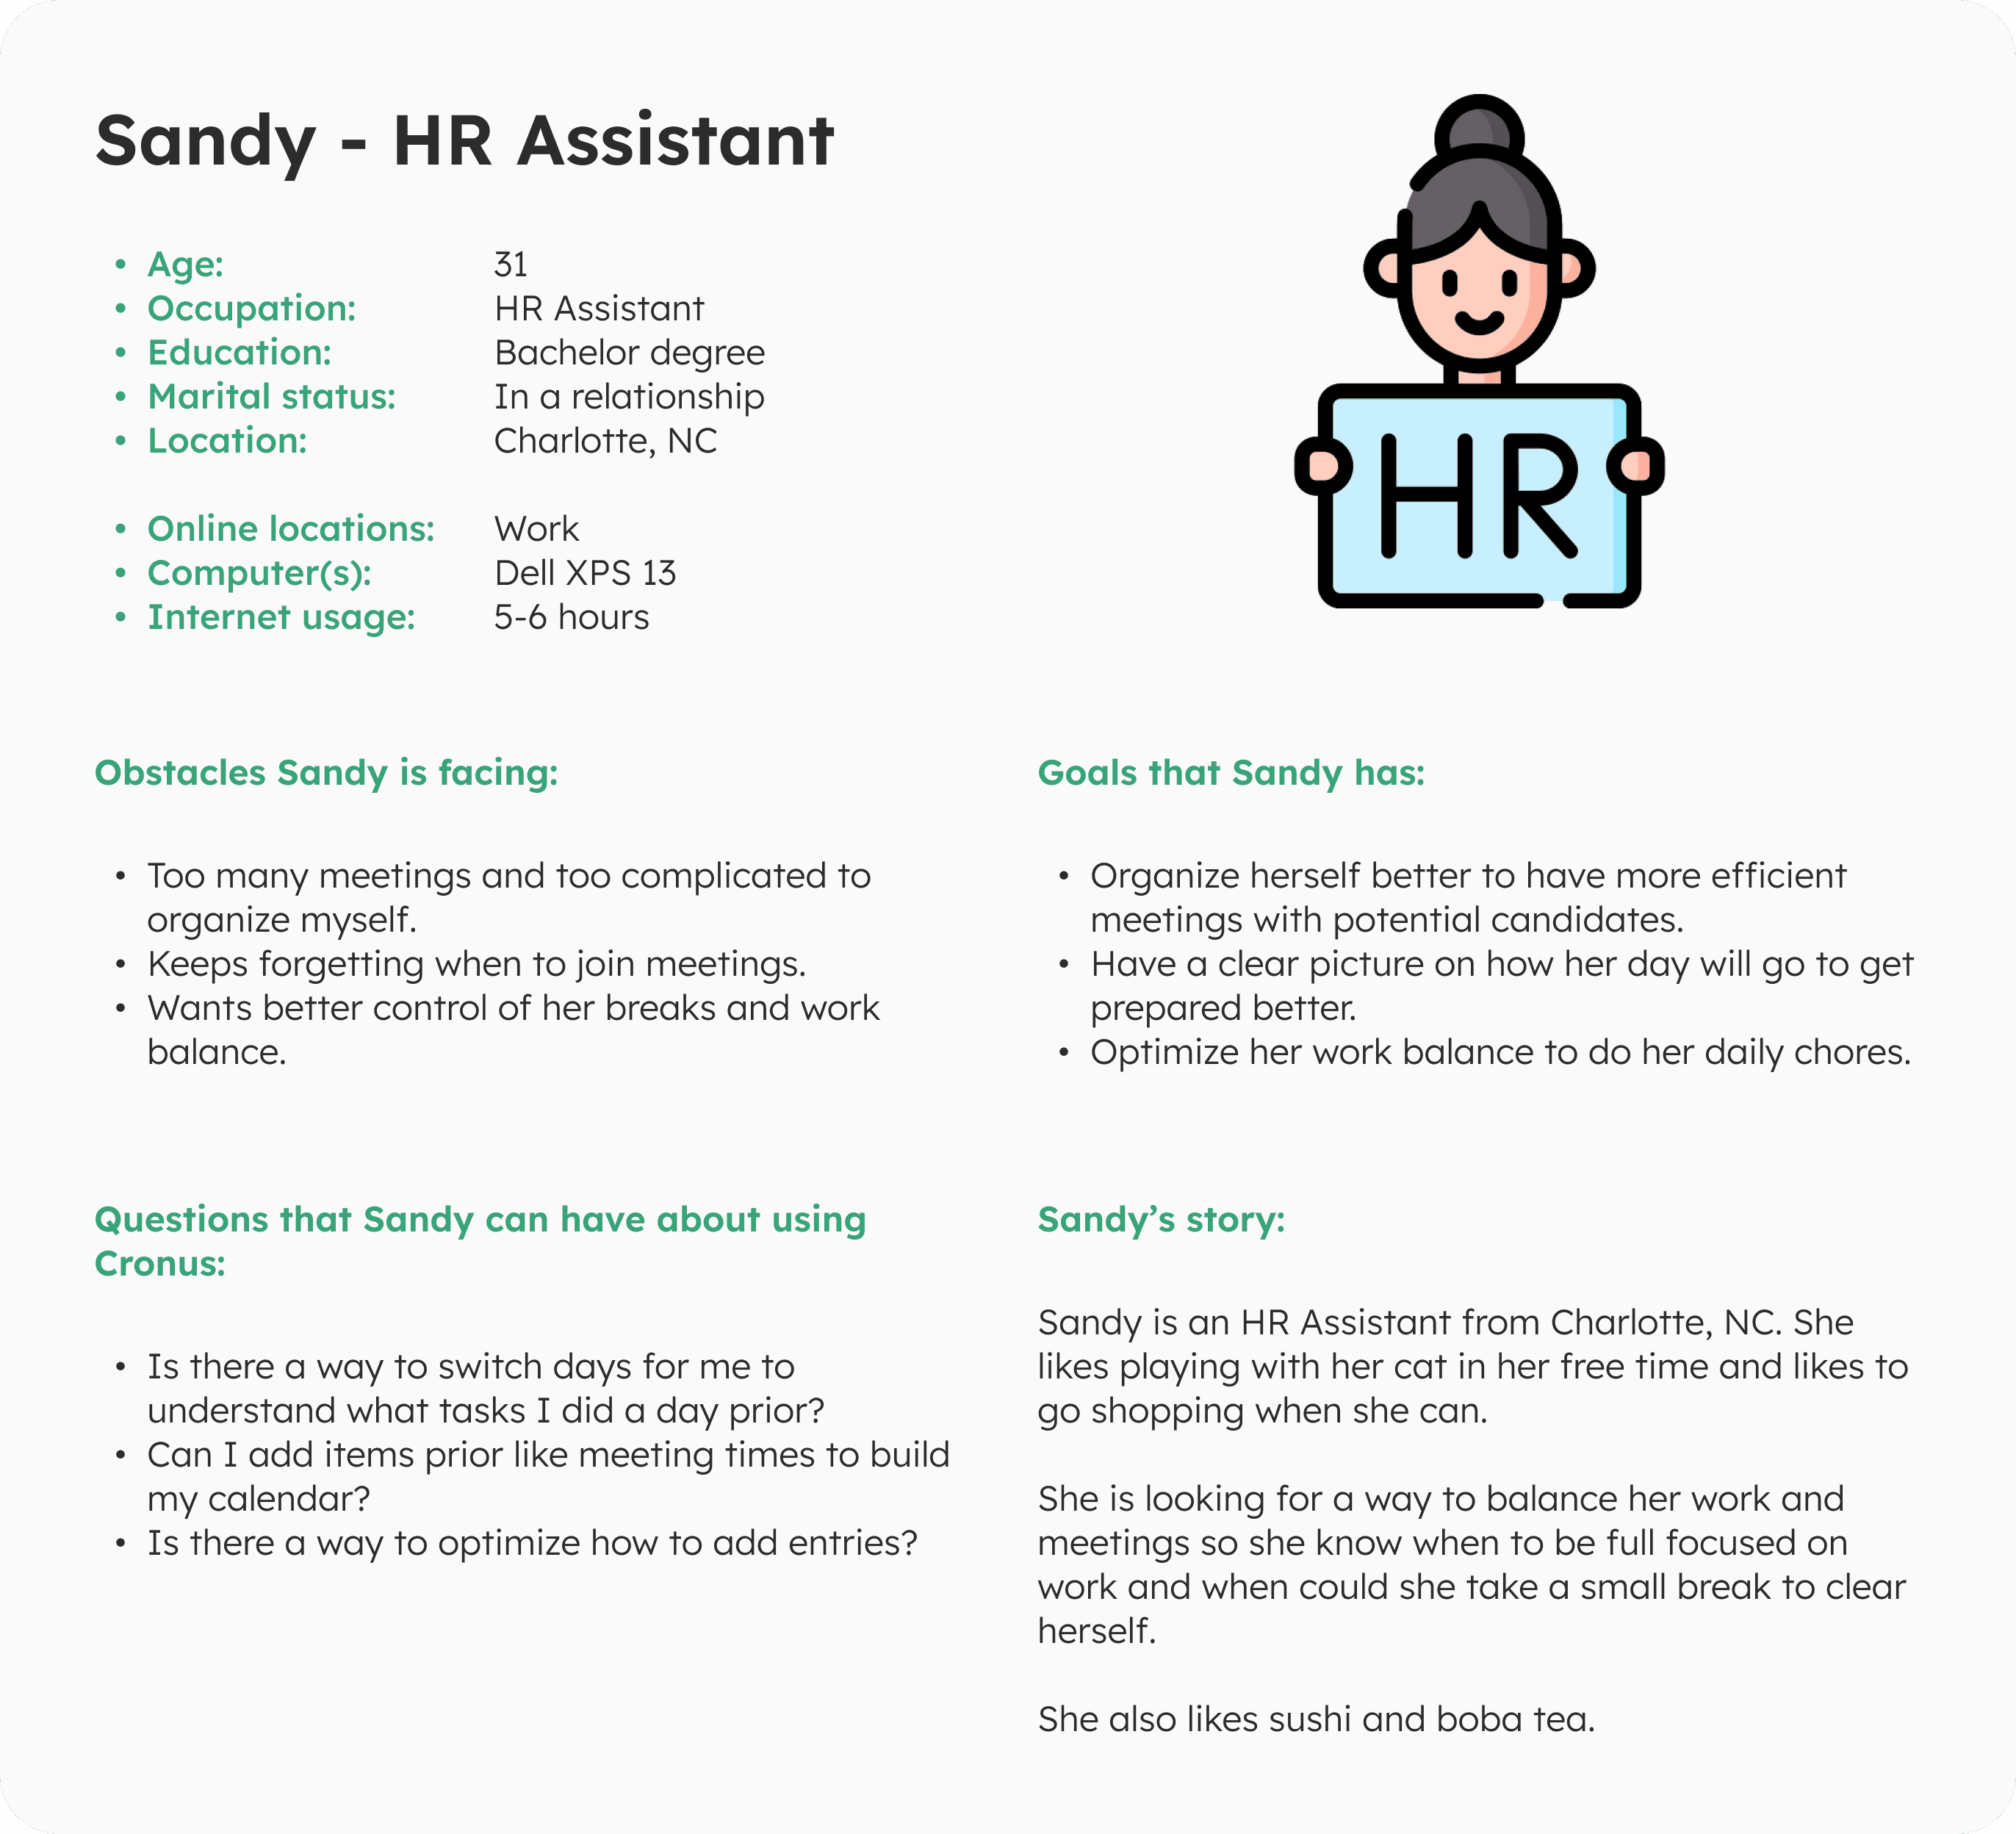
Personas & Pain Points
Personas & Pain Points
Personas & Pain Points
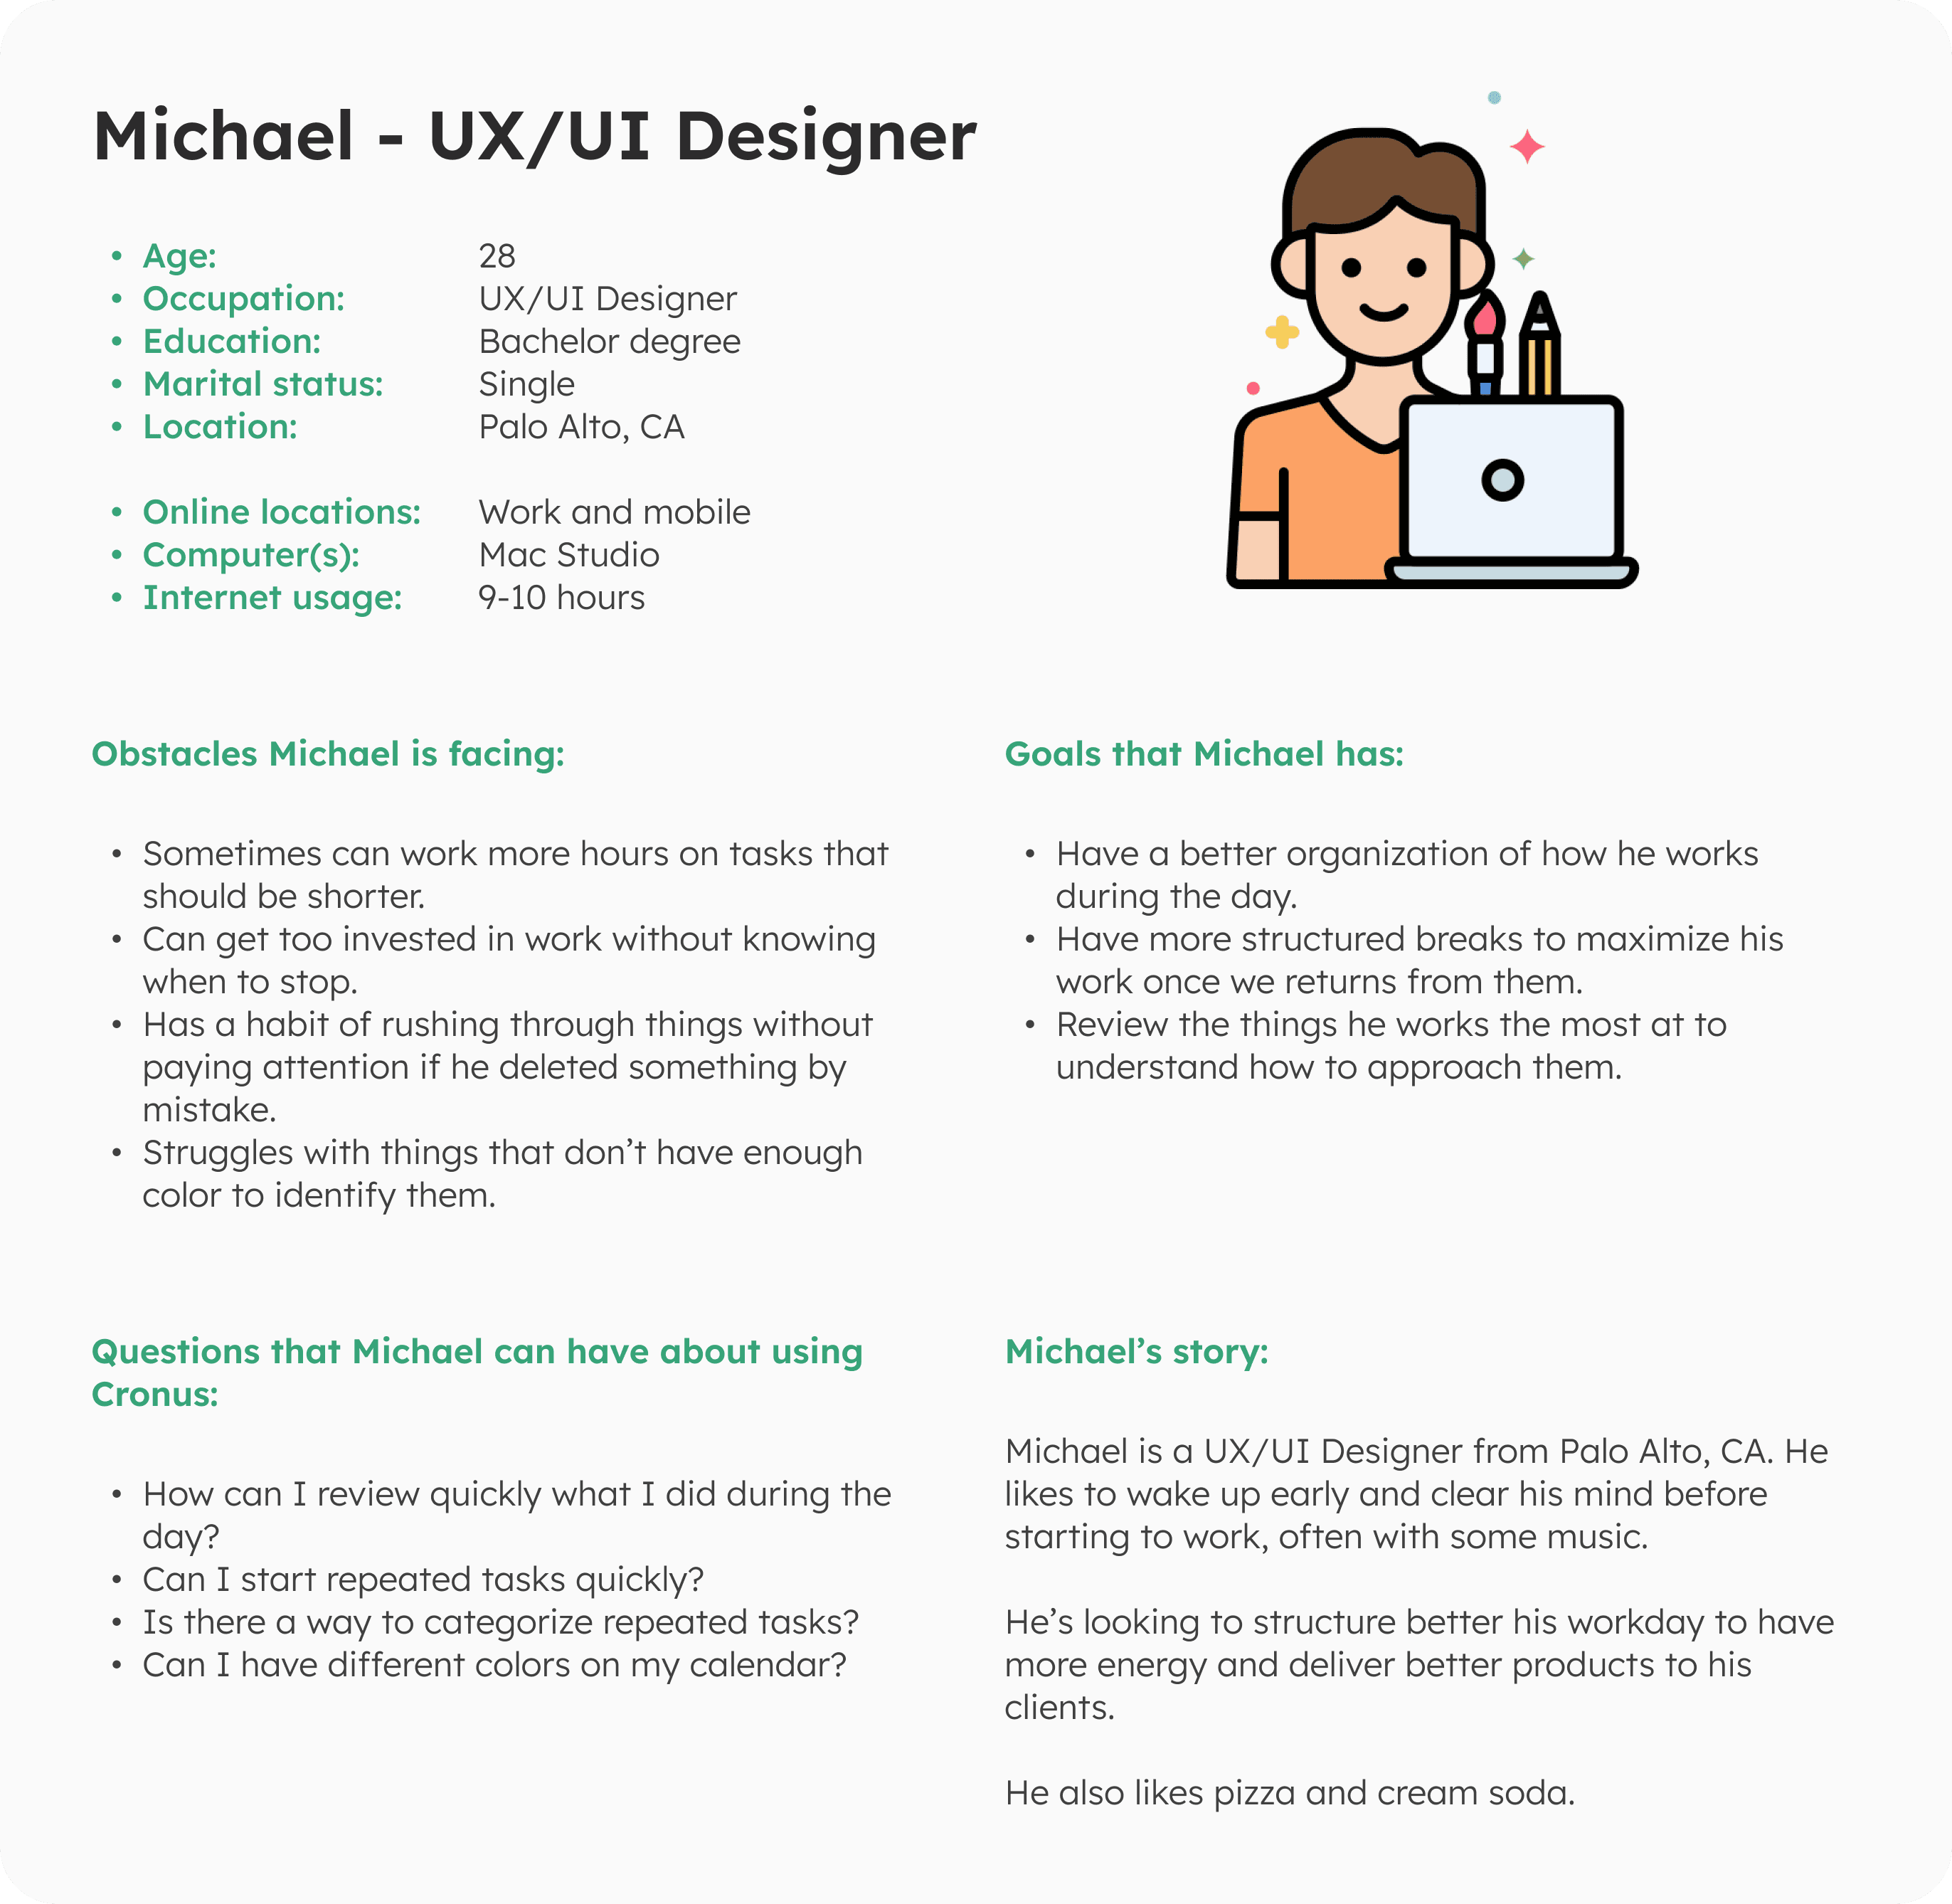
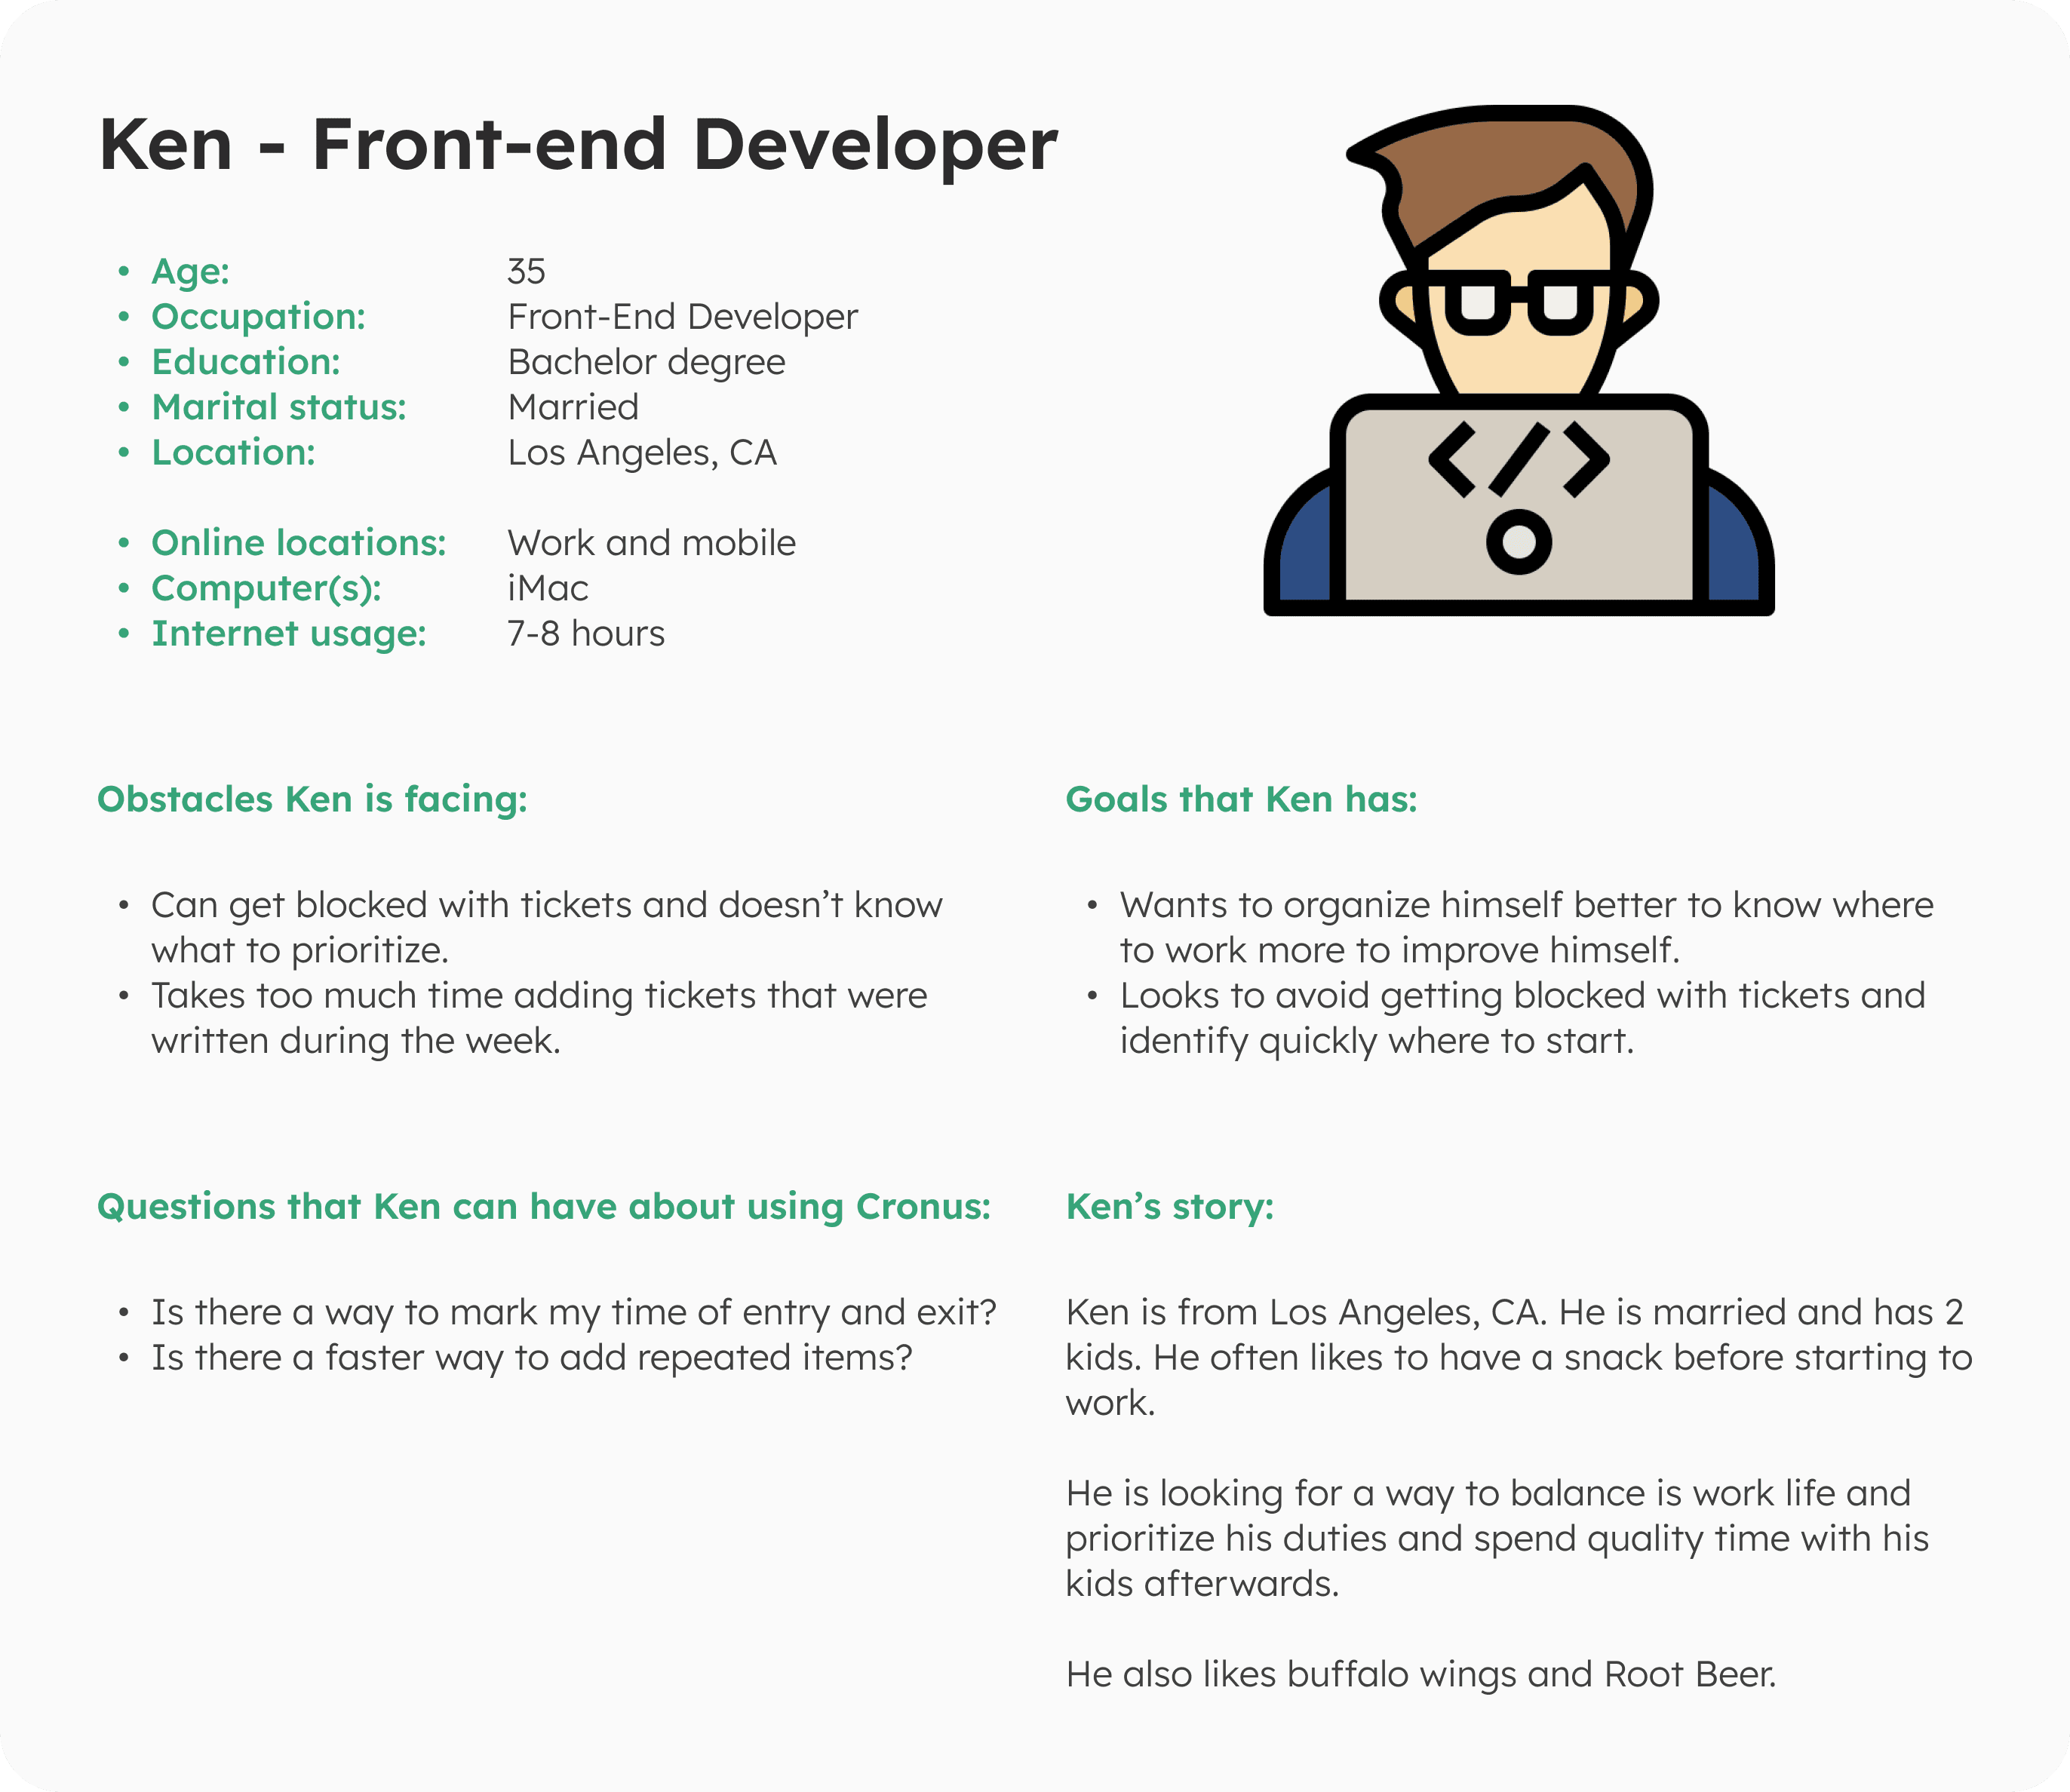
To create the personas, we conducted interviews with multiple members of the company that use the platform to understand how they use it, what they like and dislike about it.
Some of the pain points brought up were the following:
Editing an entry can be confusing and you can delete it by accident.
It’s difficult to click time blocks on the Calendar view.
It’s difficult to find entries in a timeline.
It needs colors to make more contrast for better visibility.
Users sometimes use different calendars and want to sync their meetings to see if nothing collides.
User flow
User flow
User flow
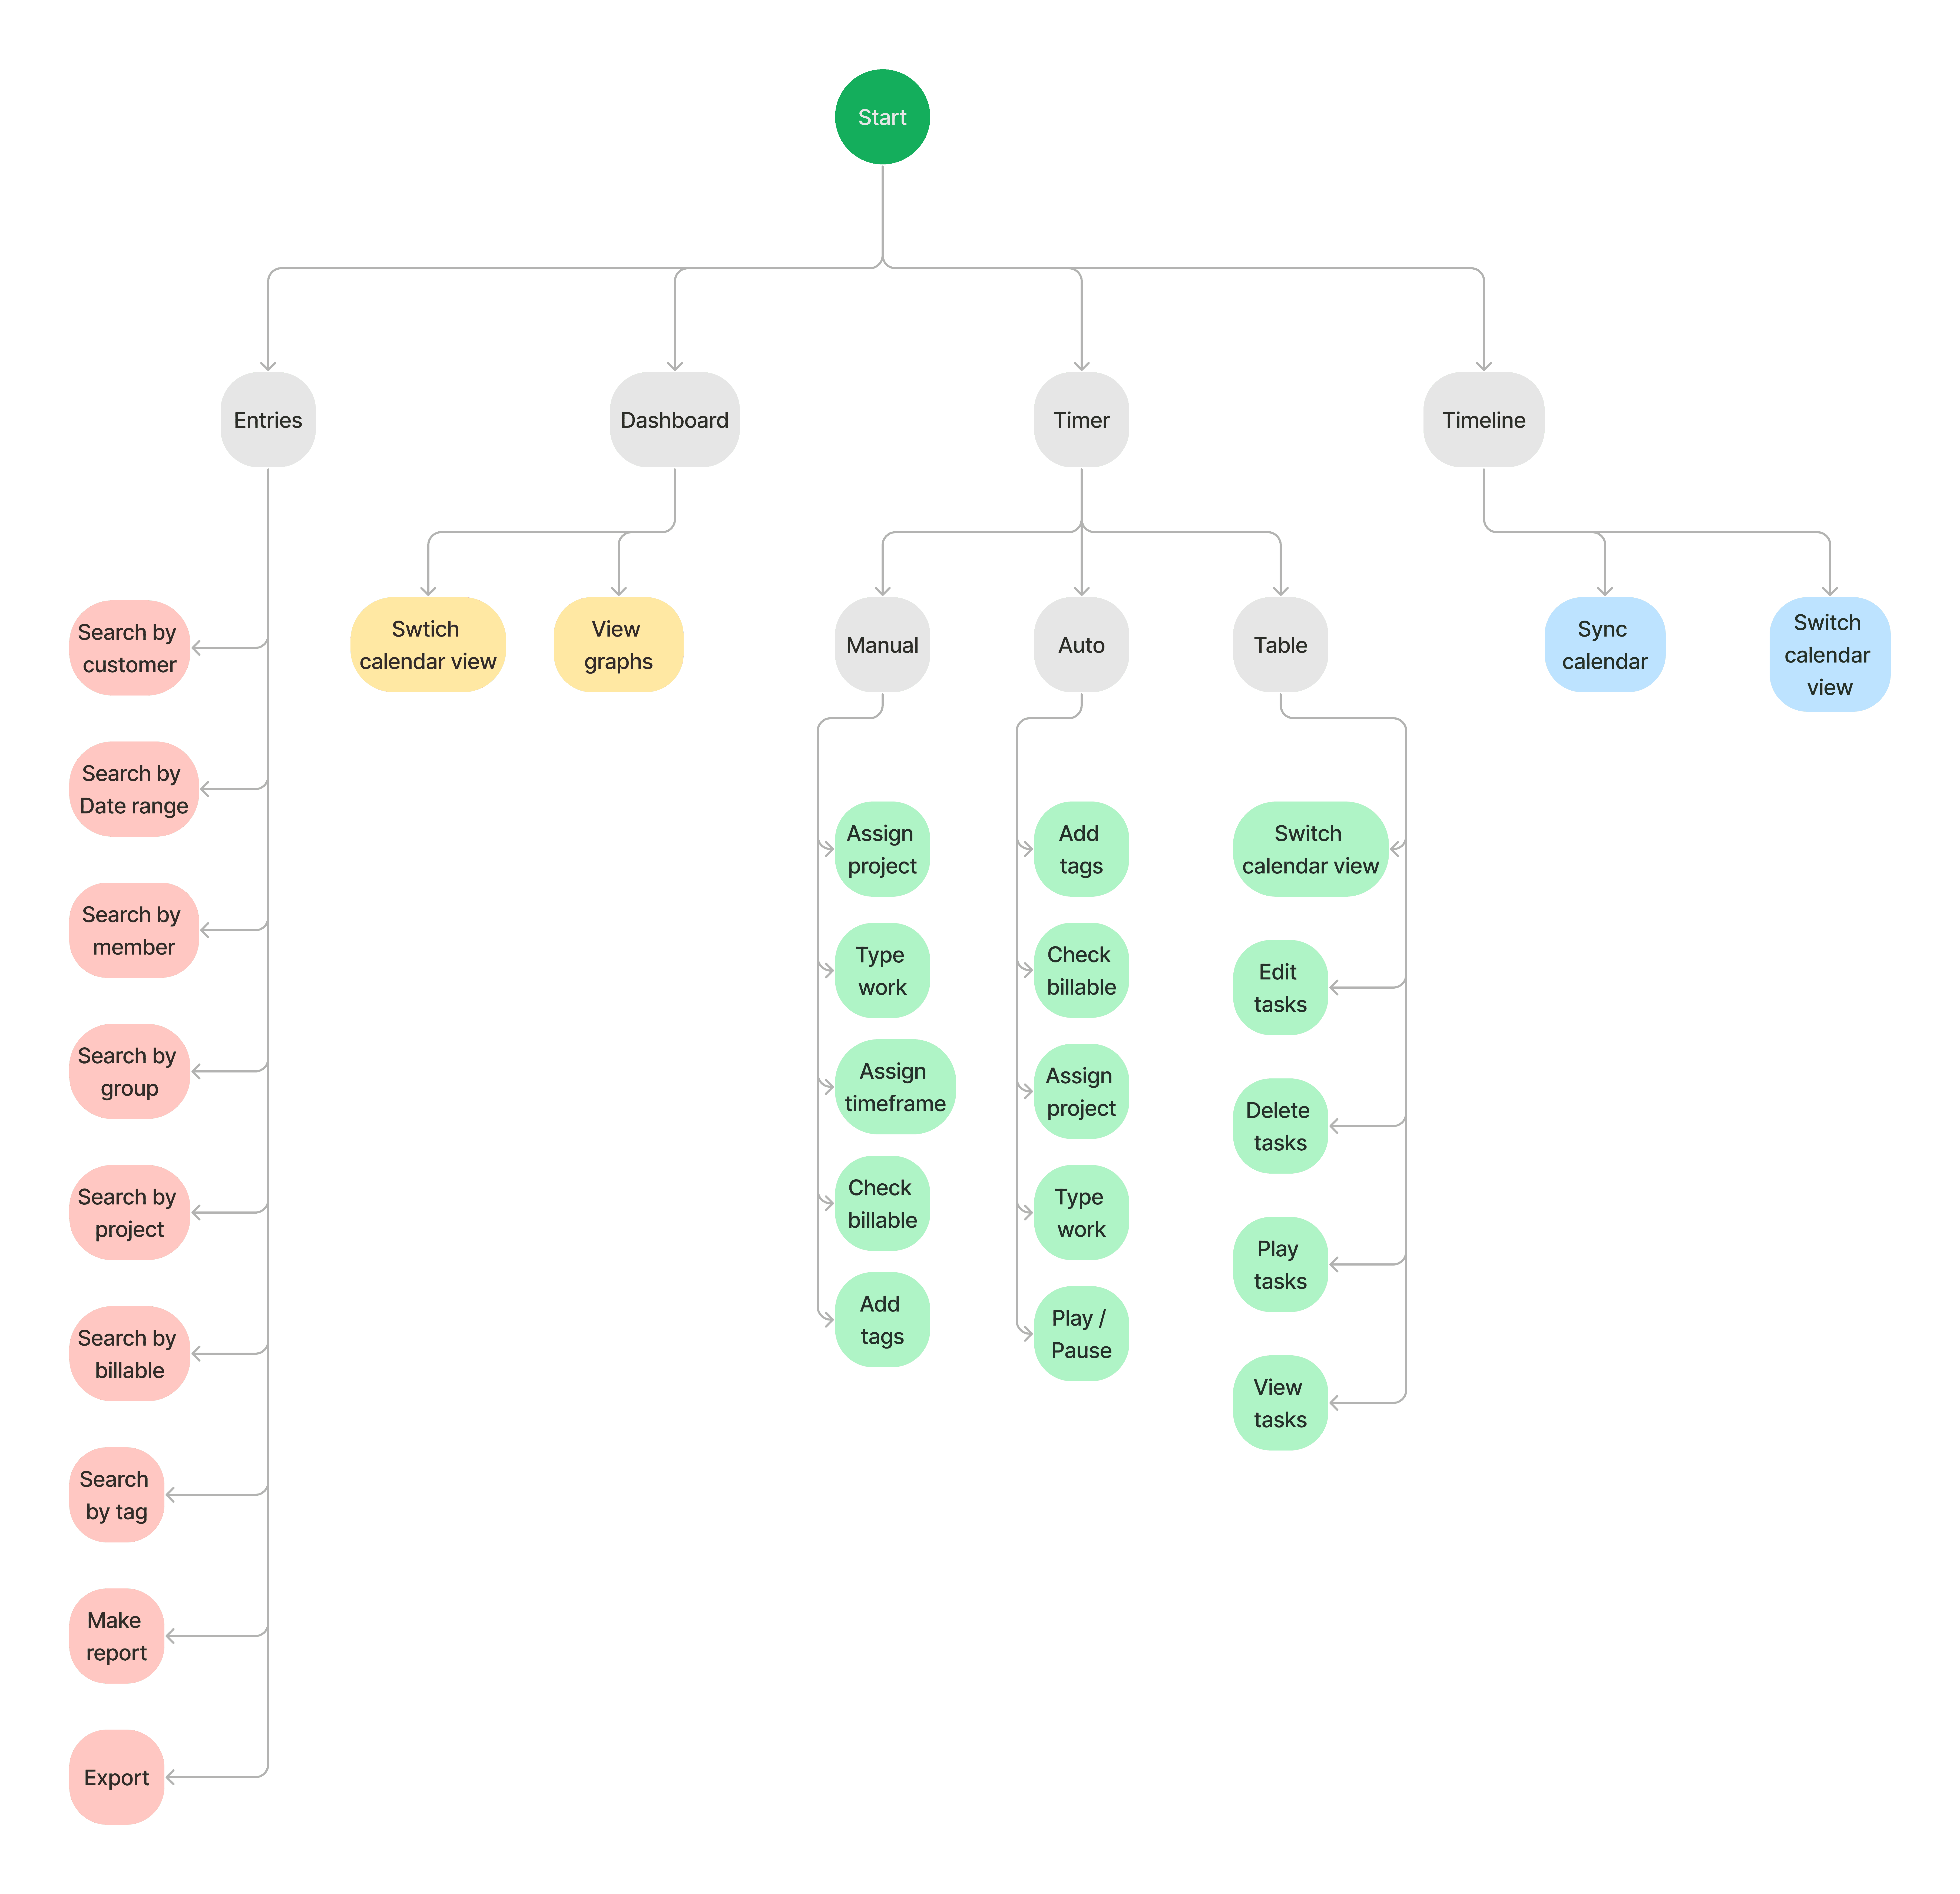
Based on the research, a user flow was crafted to review how the user would navigate and interact with the elements on the website.
Based on the research, a user flow was crafted to review how the user would navigate and interact with the elements on the website.
Wireframes
Wireframes
Wireframes
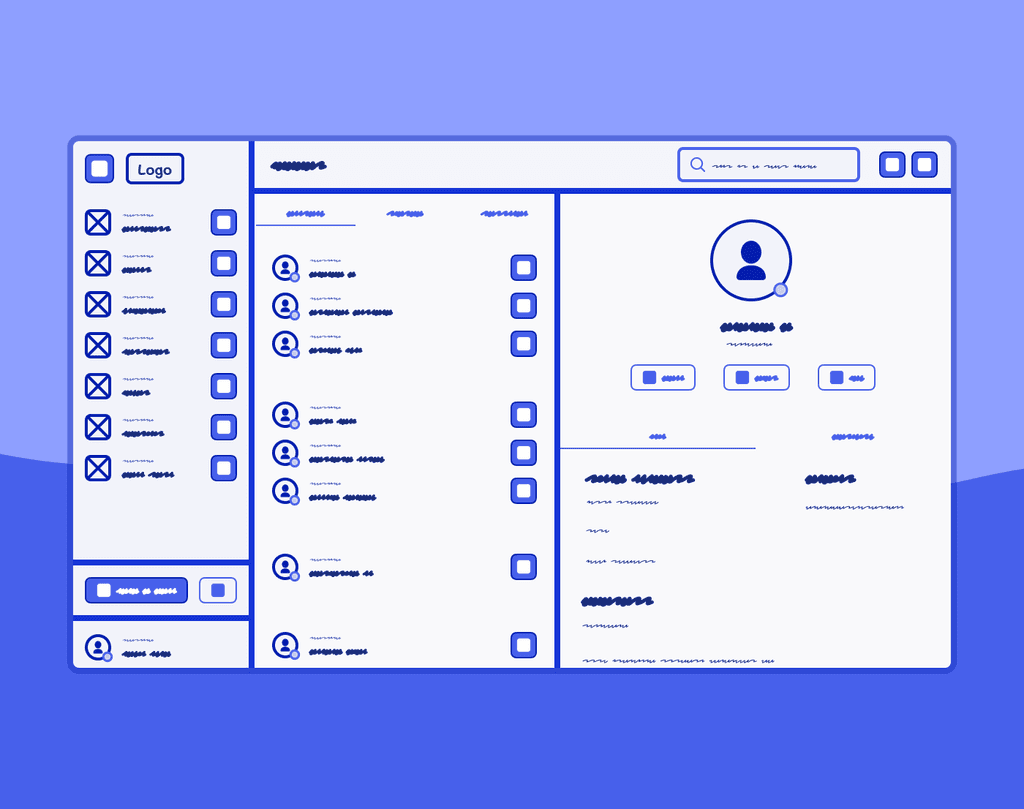
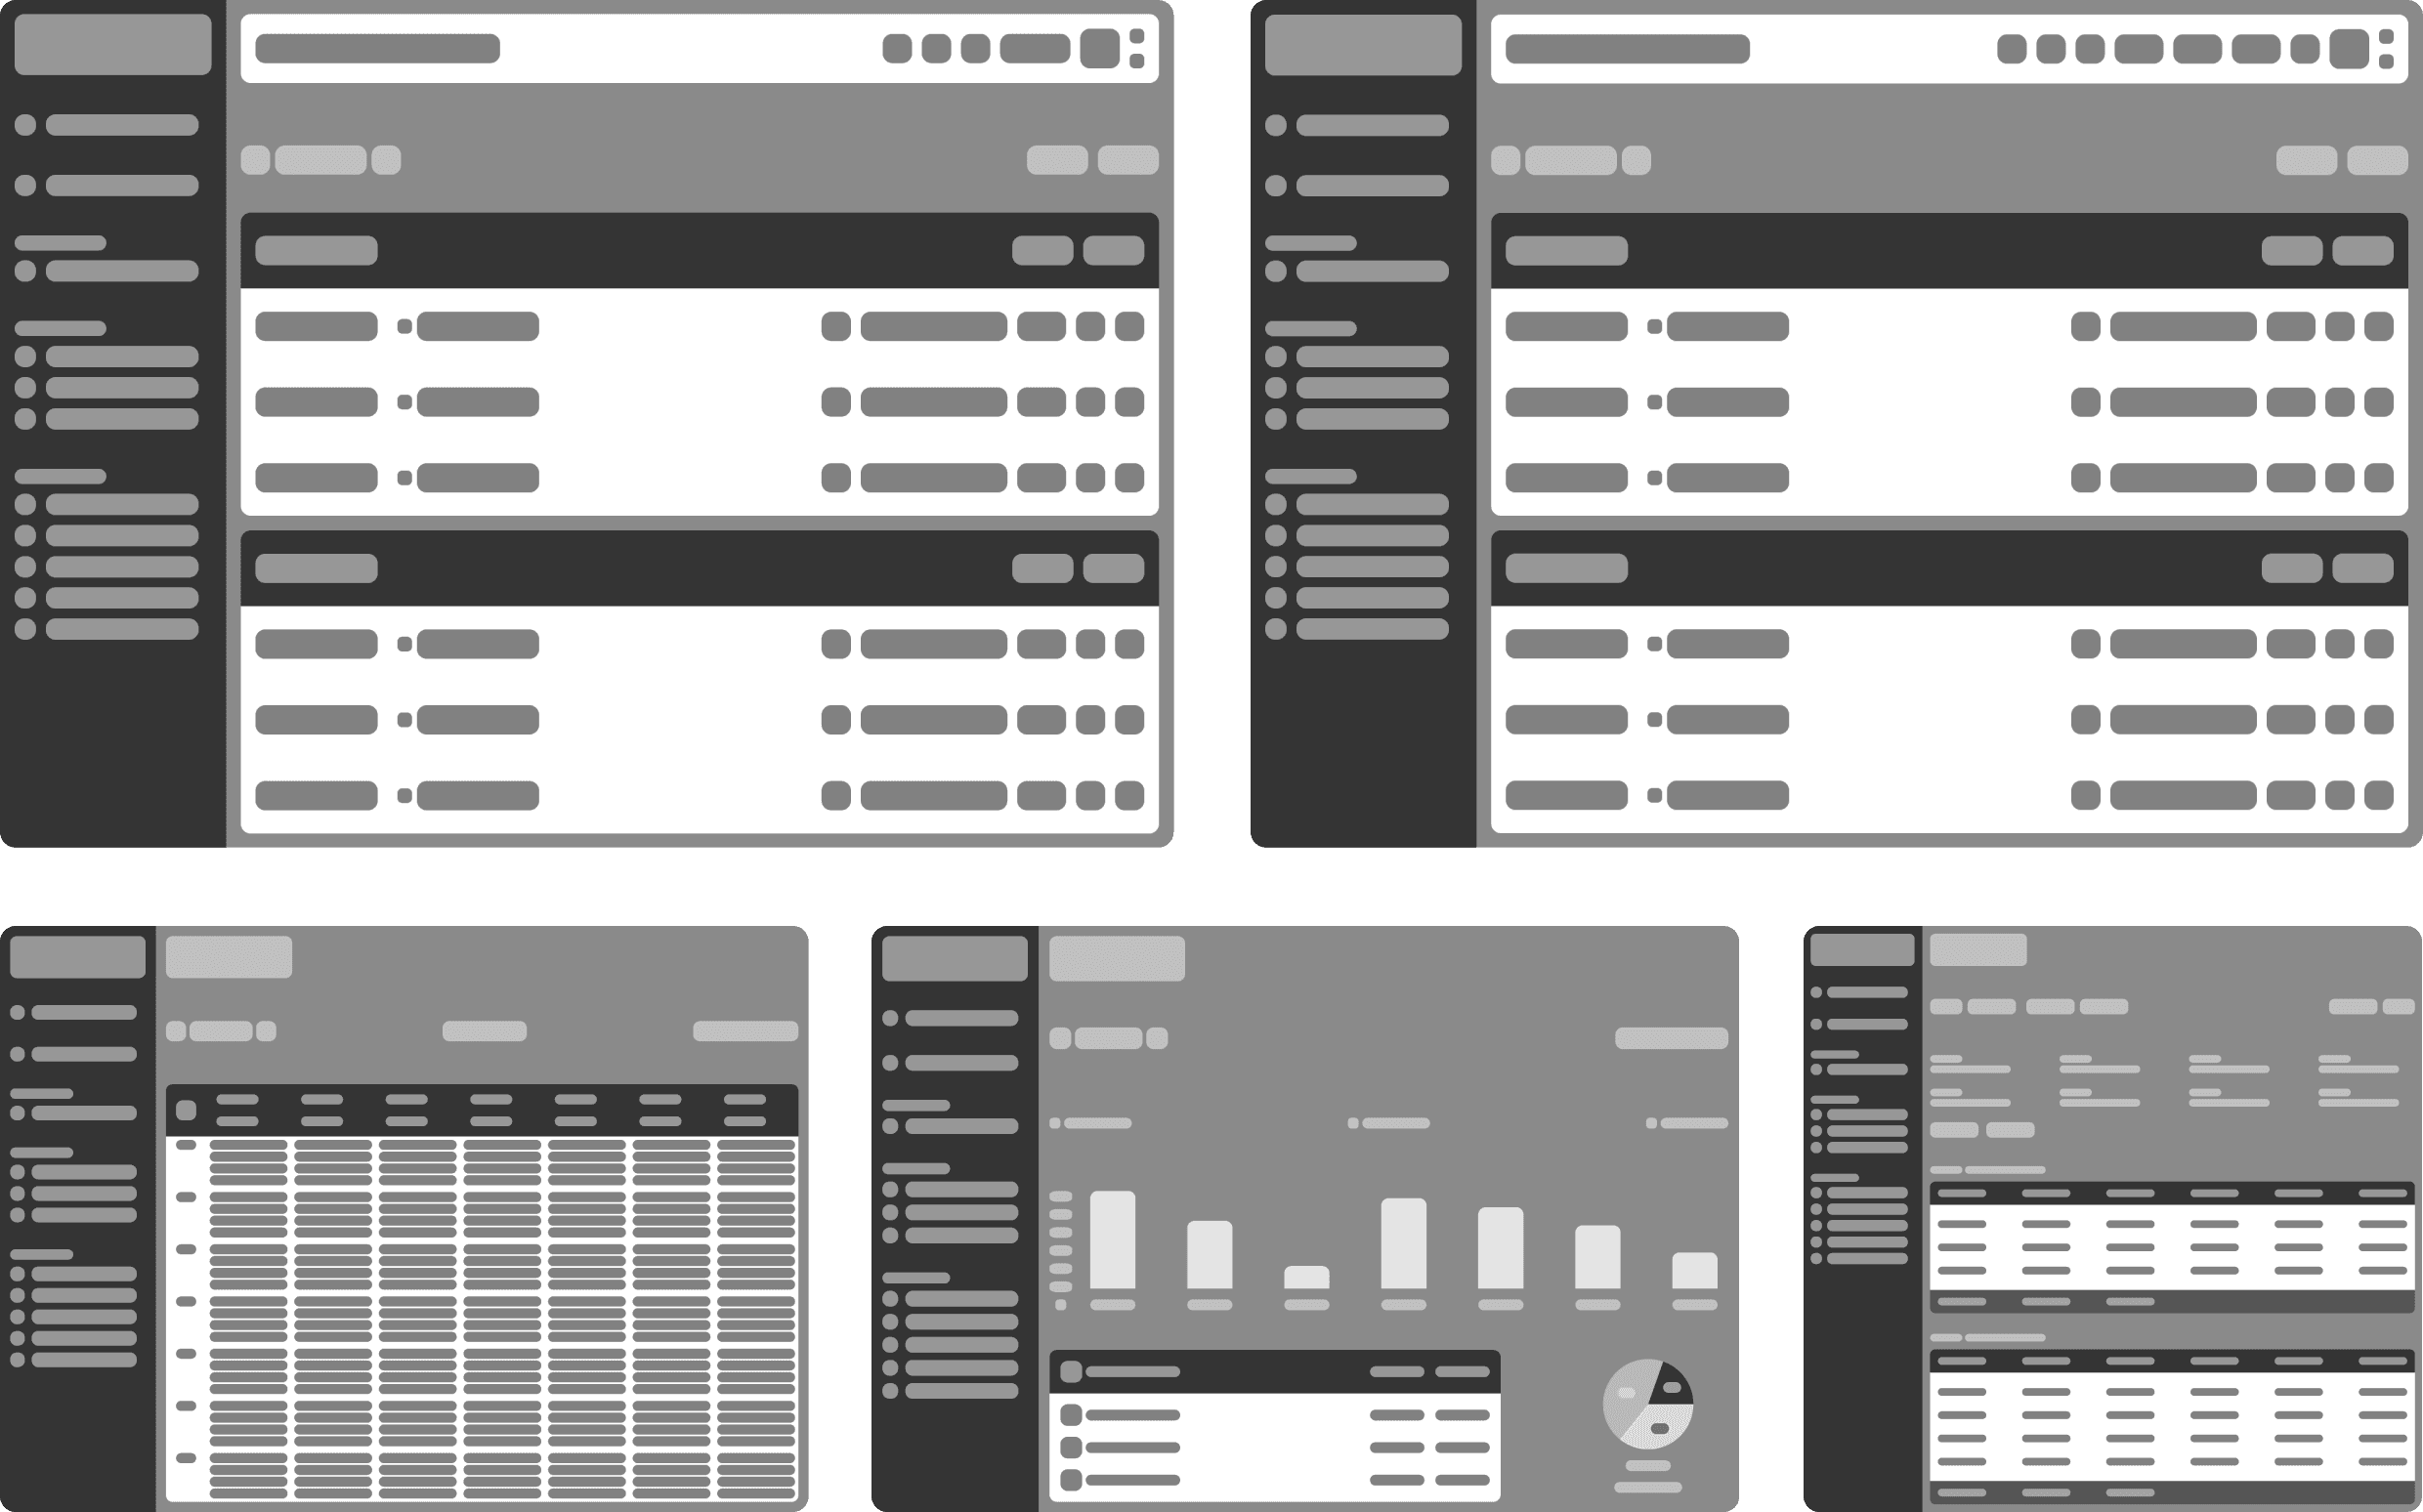
At this step, I started structuring the new design of the platform and went with wireframing the process.
The key areas I wanted to improve were:
Giving more focus to the total amount of hours worked per day and week.
Having the ability to focus on tasks performed during a specific day or week.
Easier access to manage the calendar without deleting entries.
Syncing calendars with other apps for allotting time efficiently.
Getting a clearer view of the entries page with easy to understand graphs.
Better search and filter to access quickly to previous entries.
First iteration
First iteration
First iteration
Second iteration
Second iteration
Second iteration
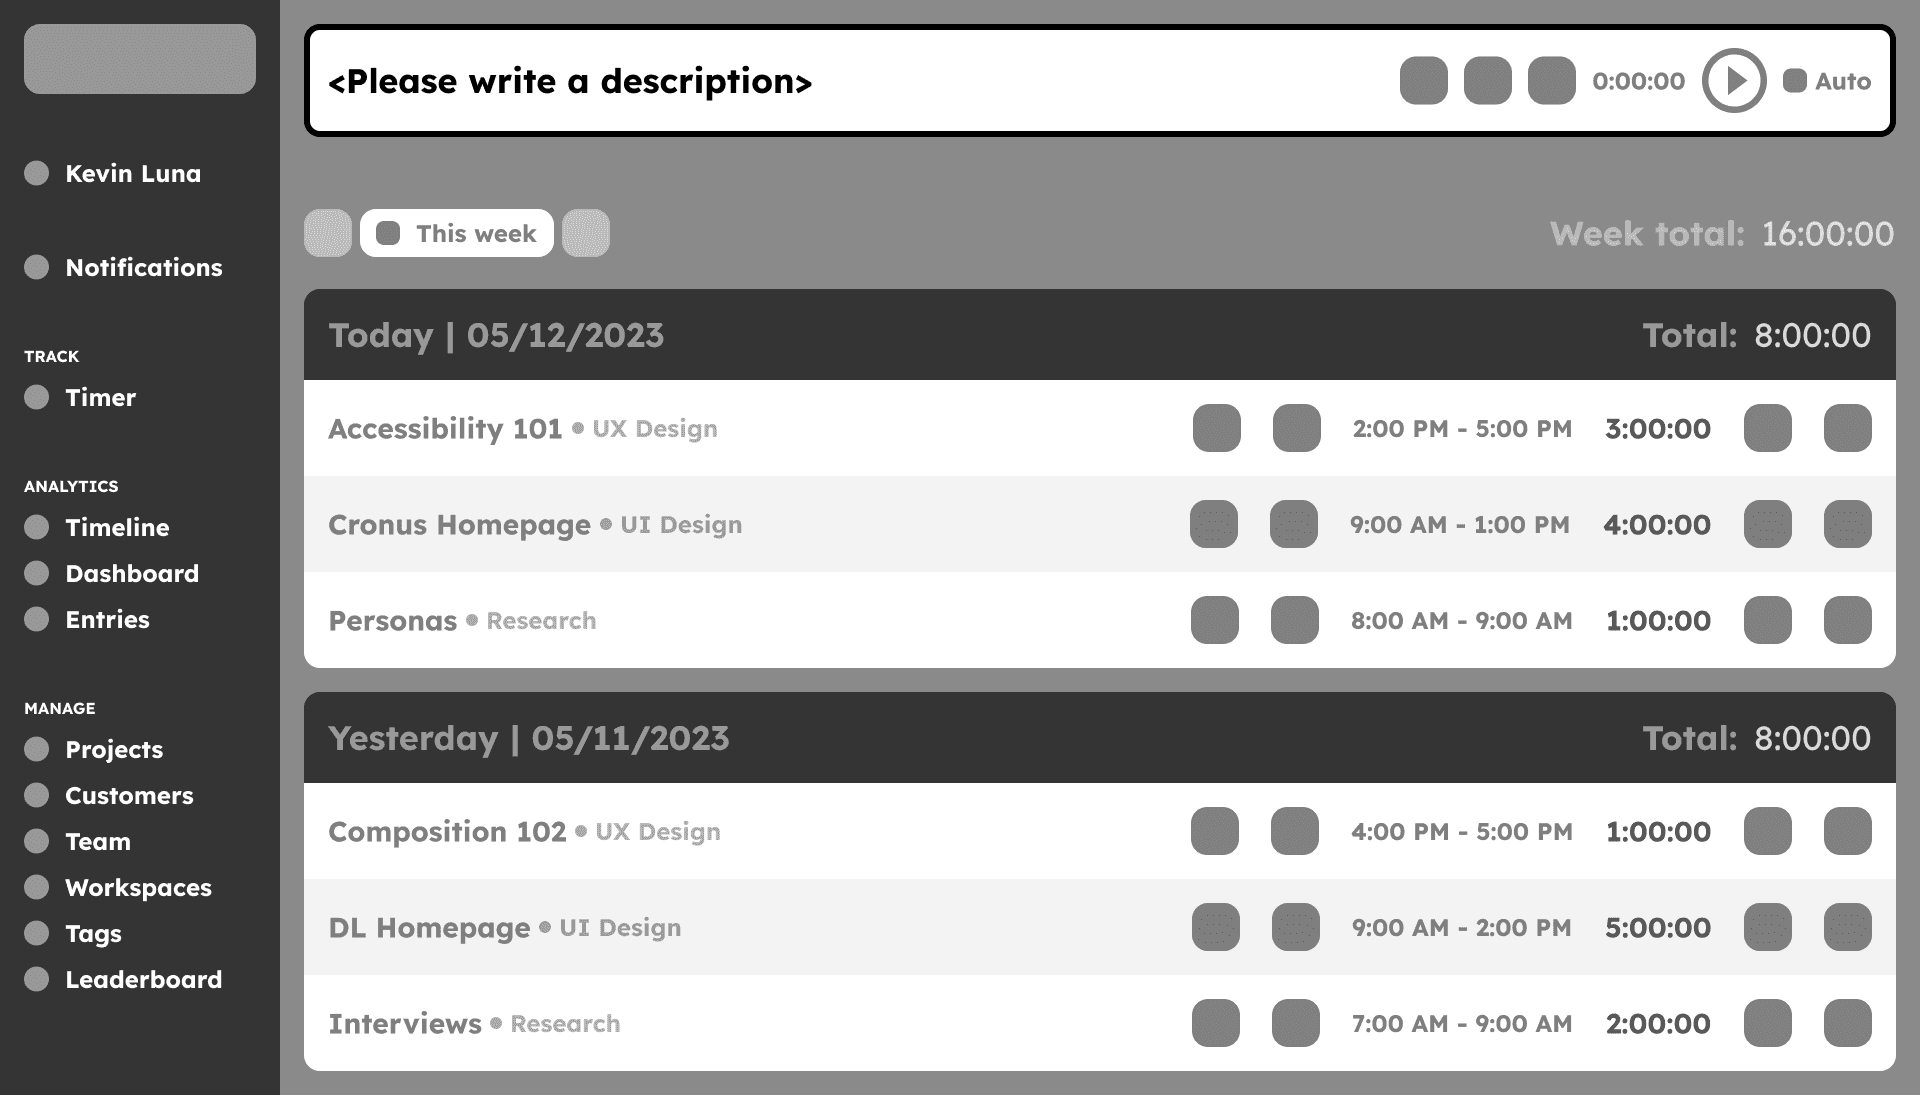
Decision #1 - Play blank entry
Decision #1 - Play blank entry
Decision #1 - Play blank entry
a) Mark as error
a) Mark as error
a) Mark as error
b) Mark as "No description" (Selected)
b) Mark as "No description" (Selected)
b) Mark as "No description" (Selected)
This first decision involved playing a blank entry when starting to work. The decisions were between marking it as an error or giving you the chance to play the entry with a “No description” title.
We went with “option b)” due to the fact that when we interviewed different people, they sometimes mentioned that they filled their entries later or just needed to press play quickly and keep working and having the ability to do this without stopping to think for a title and lose concentration on their work can help them remain focused on their tasks.
Decision #2 - Resume previous entry
Decision #2 - Resume previous entry
Decision #2 - Resume previous entry

a) Resume on top (Selected)
a) Resume on top (Selected)
a) Resume on top (Selected)

b) Resume on bottom
b) Resume on bottom
b) Resume on bottom
This second decision involved resuming an entry that was previously stopped. The first option was resuming it on the top bar and the second option was resuming it on the bottom, where it was placed once it was stopped on the first time.
We went with “option a)” due to the fact that it’s easier for the user to assume that the top bar is the main timer to display their tasks as time goes by. If the timer is used only in the bottom section, the user can forget that the timer is still running there.
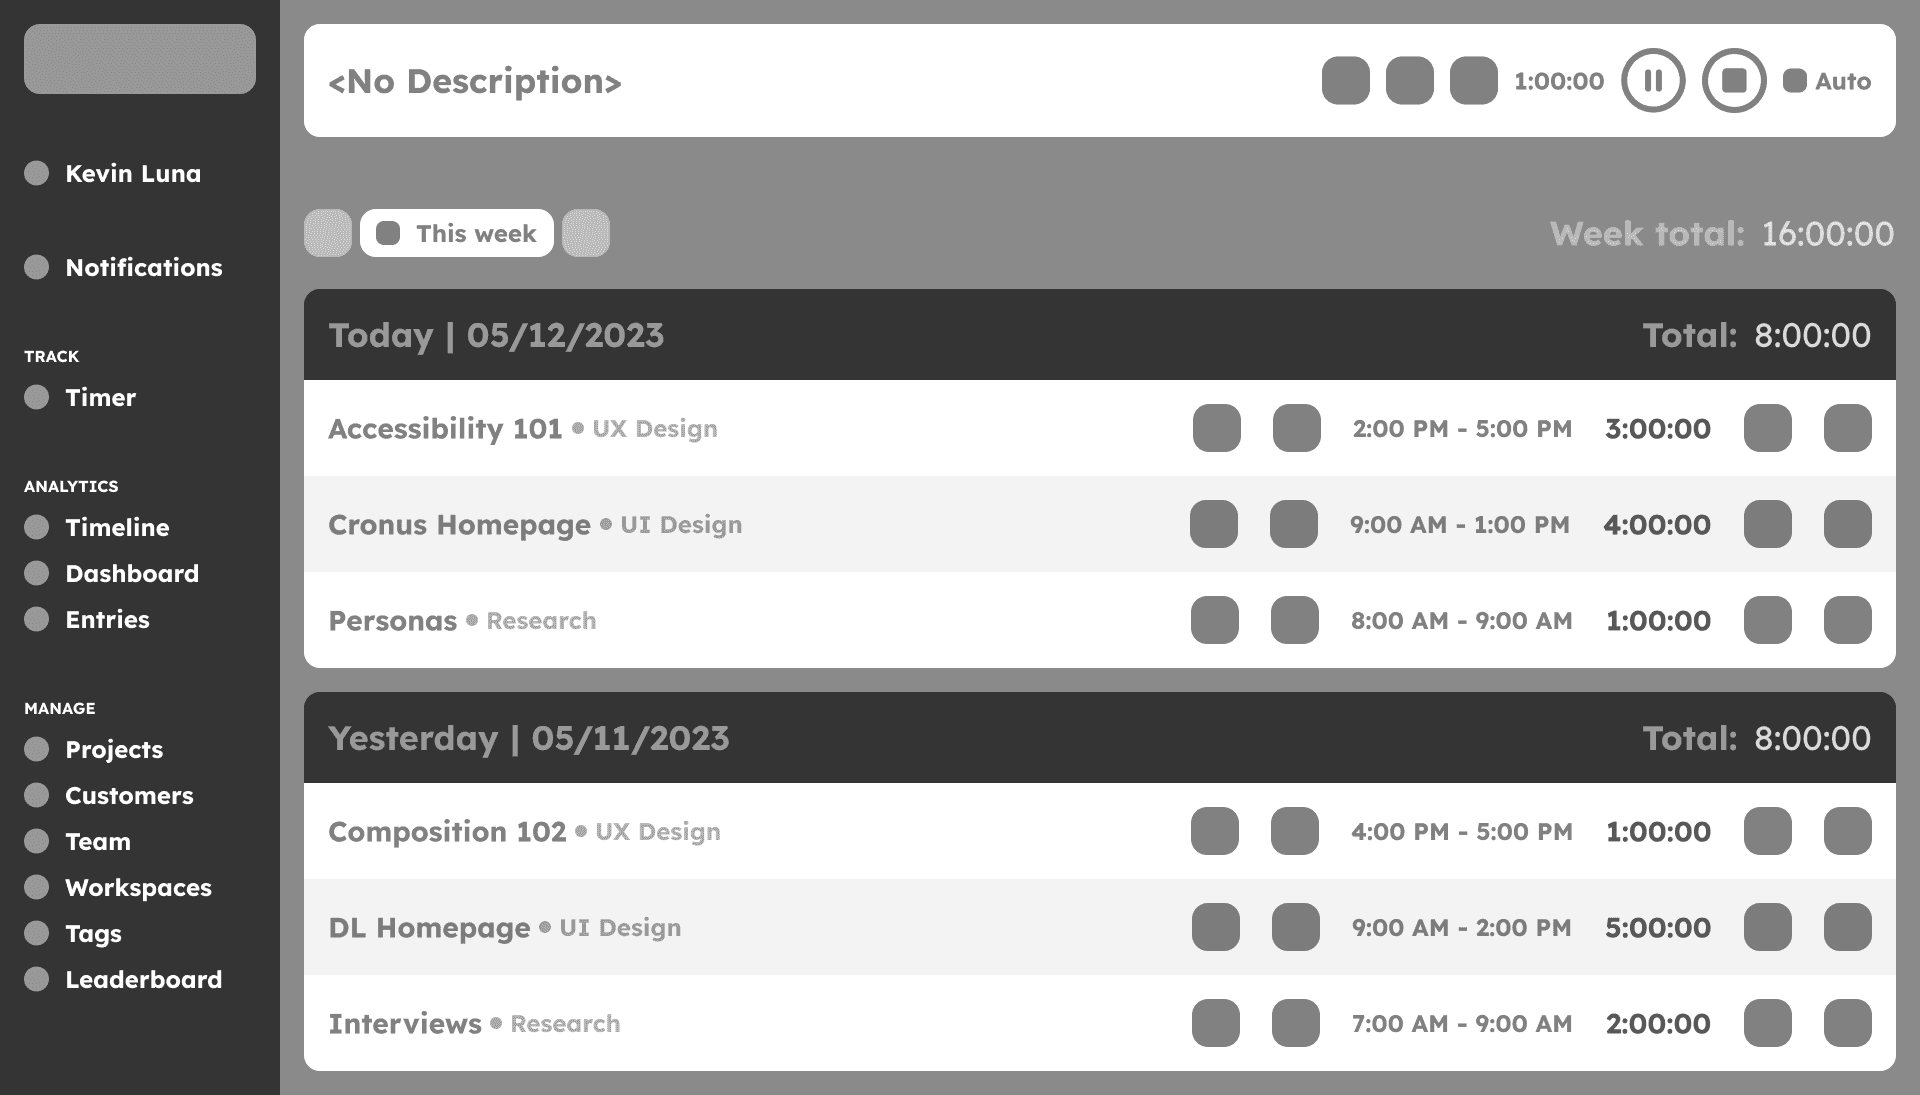
Decision #3 - Delete entry
Decision #3 - Delete entry
Decision #3 - Delete entry
a) Delete by menu
a) Delete by menu
a) Delete by menu
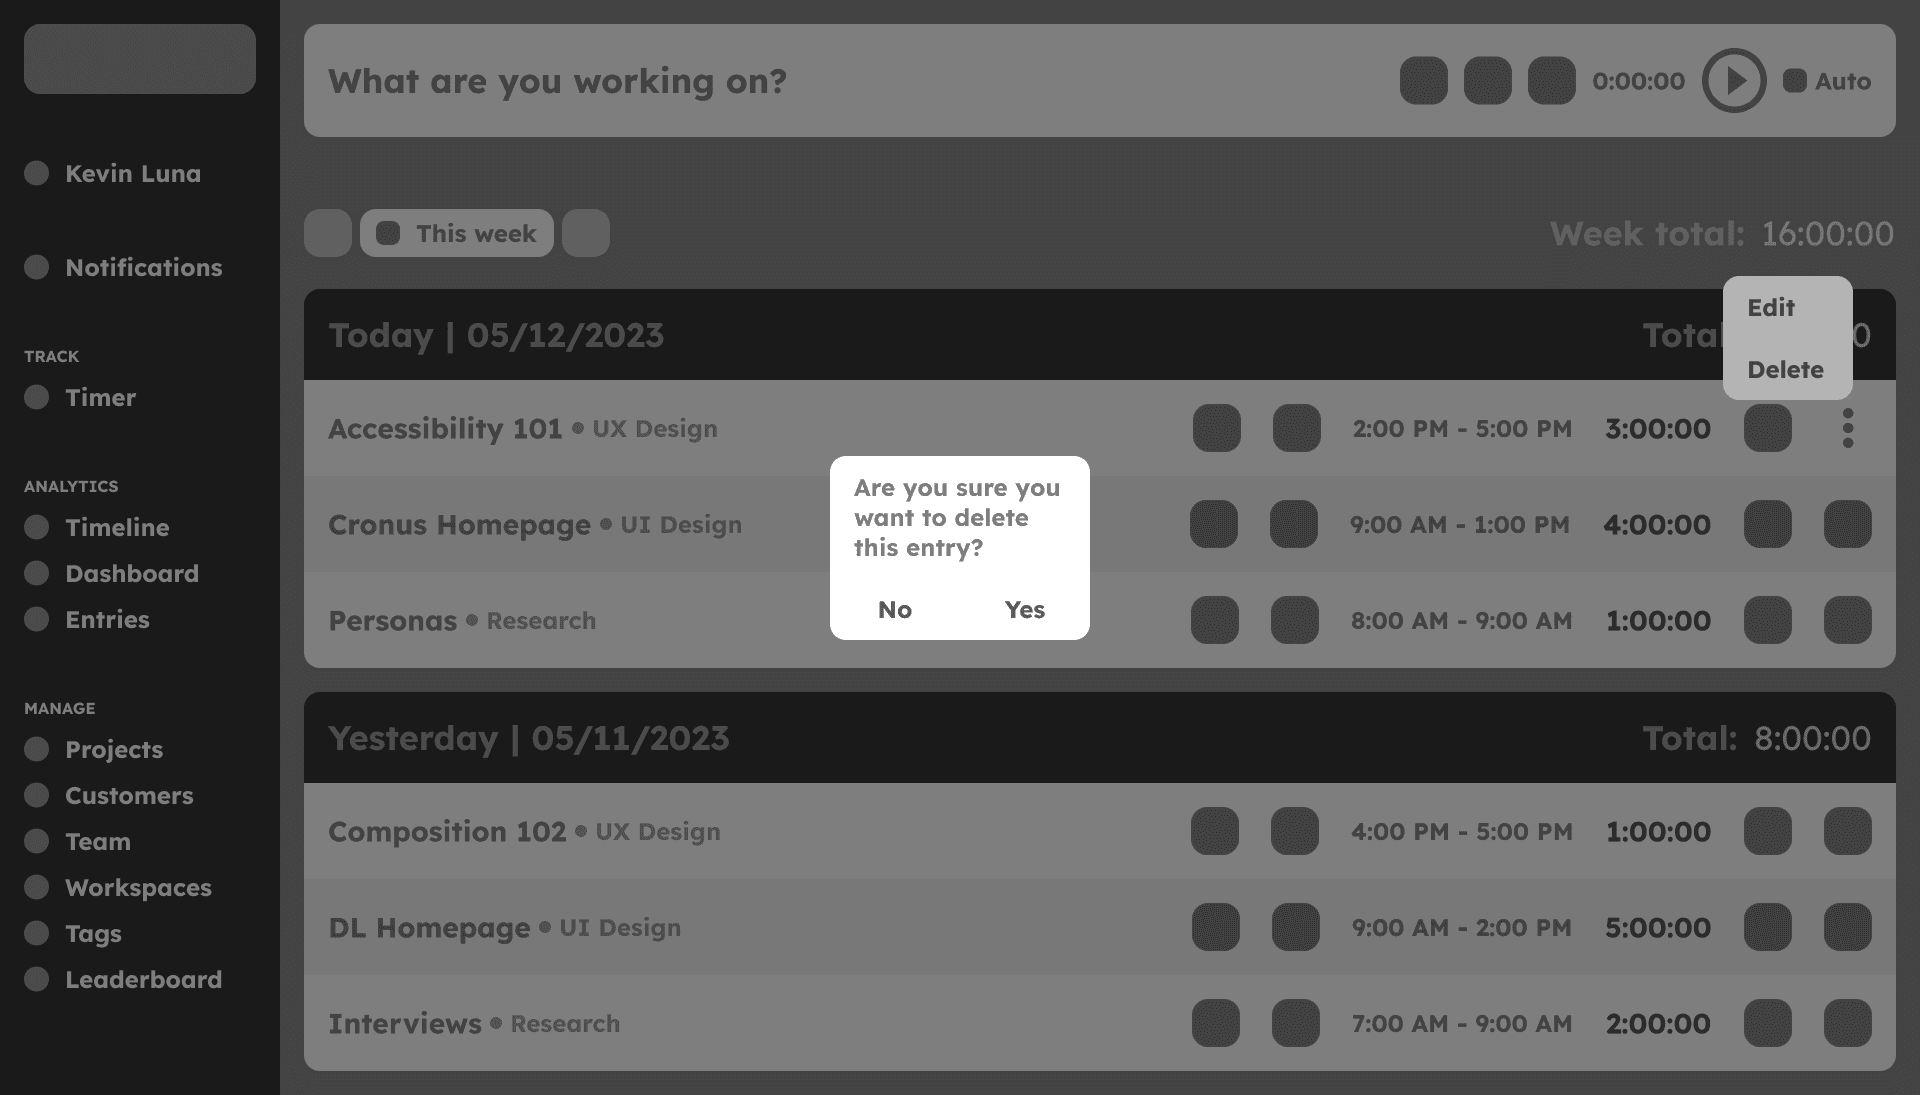
b) Delete by dialog (Selected)
b) Delete by dialog (Selected)
b) Delete by dialog (Selected)
This third decision involved deleting an entry from the board. The first option was just by deleting an entry once you clicked on the Delete option from the menu. The second option involved a second step that appears after the menu, you then get a dialog confirmation to alert you that you’re deleting an entry.
We went with “option b)” due to the fact that, as noted by users in the interview process, sometimes they can delete entries by mistake. By adding a confirm overlay, they can be assured that they have a second chance before deleting their entry.
Colors & Typography
Colors & Typography
Colors & Typography
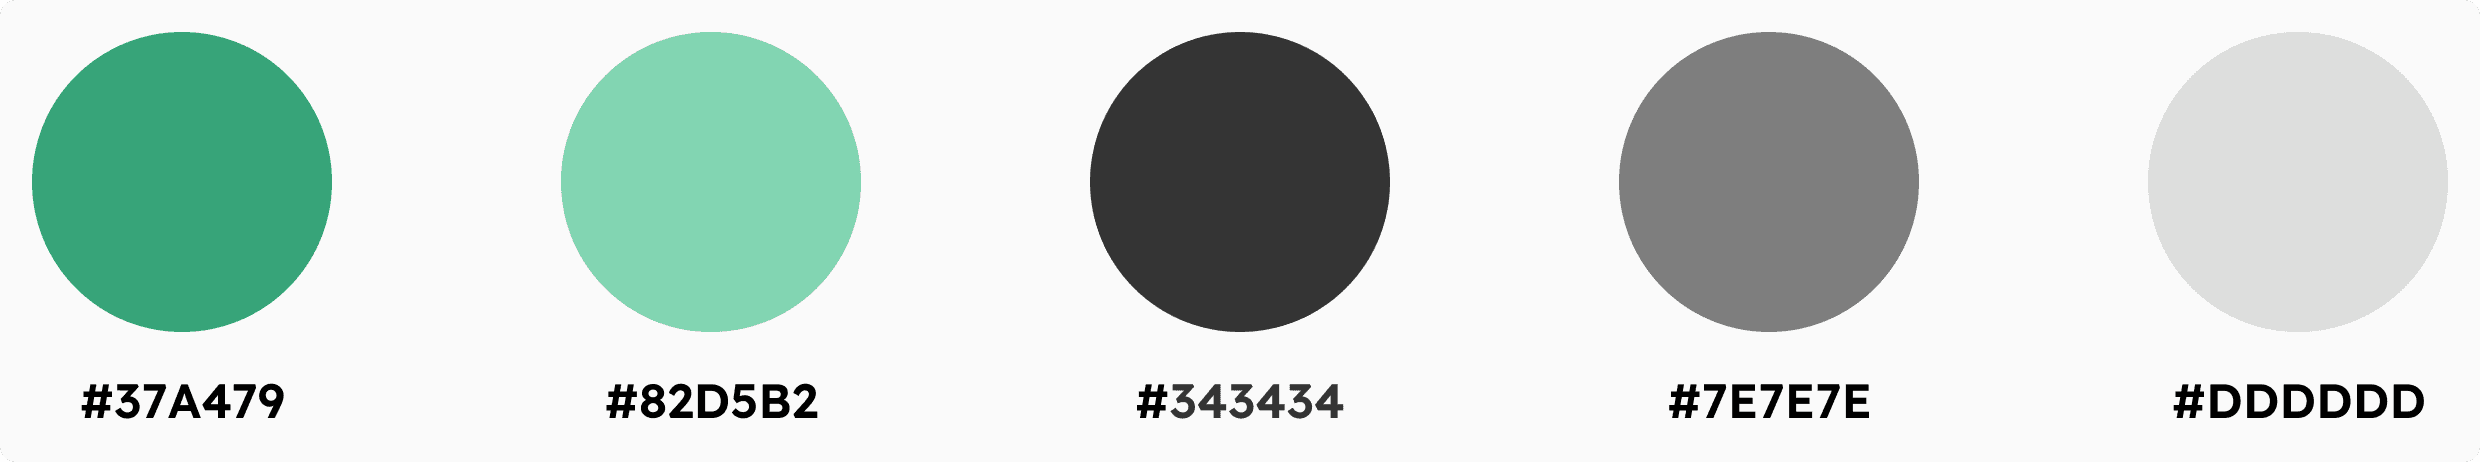
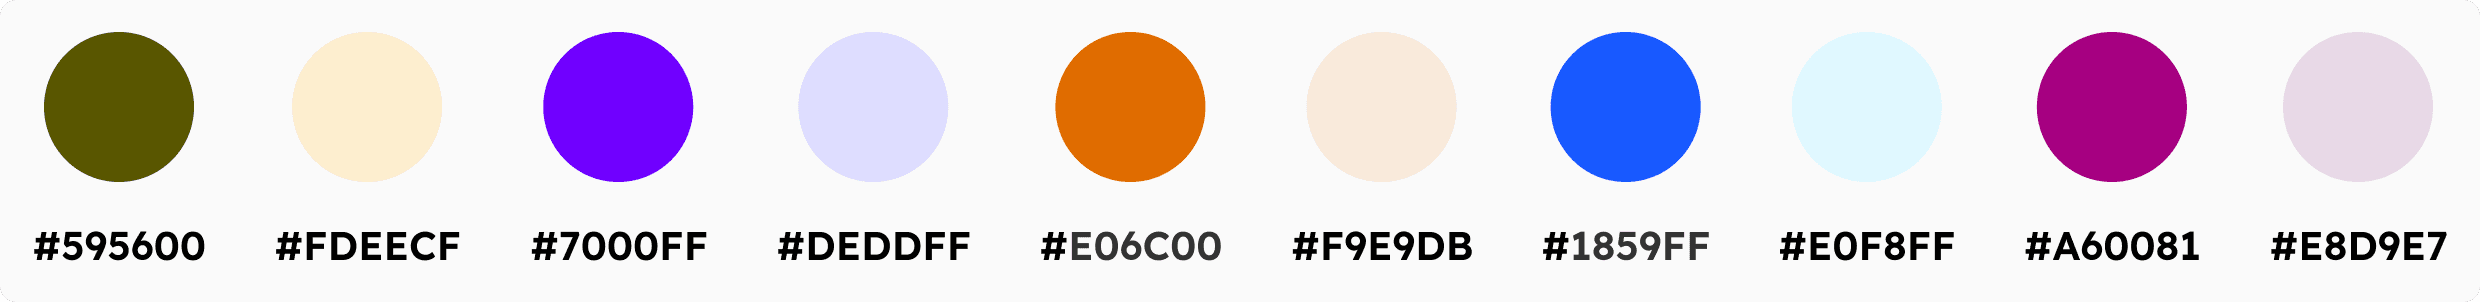
With the colors we had to use mainly the same ones that were already in use in the current design, but some additional colors were incorporated to help create more contrast between the text and the design as well as within some shapes and graphs.
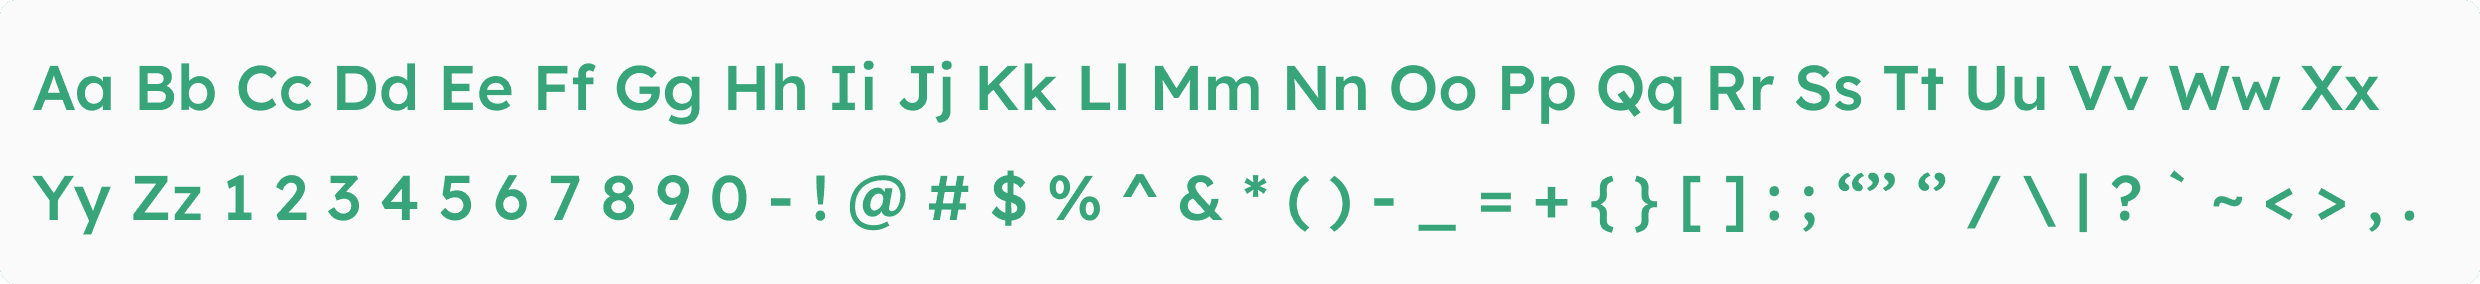
For the typography I could change it and went with a Sans Serif font called Lexend Deca that can help with readability and be easier for users to understand.
With the colors we had to use mainly the same ones that were already in use in the current design, but some additional colors were incorporated to help create more contrast between the text and the design as well as within some shapes and graphs.
For the typography I could change it and went with a Sans Serif font called Lexend Deca that can help with readability and be easier for users to understand.
Main colors
Main colors
Main colors
Highlight colors
Highlight colors
Highlight colors
Typography
Typography
Typography
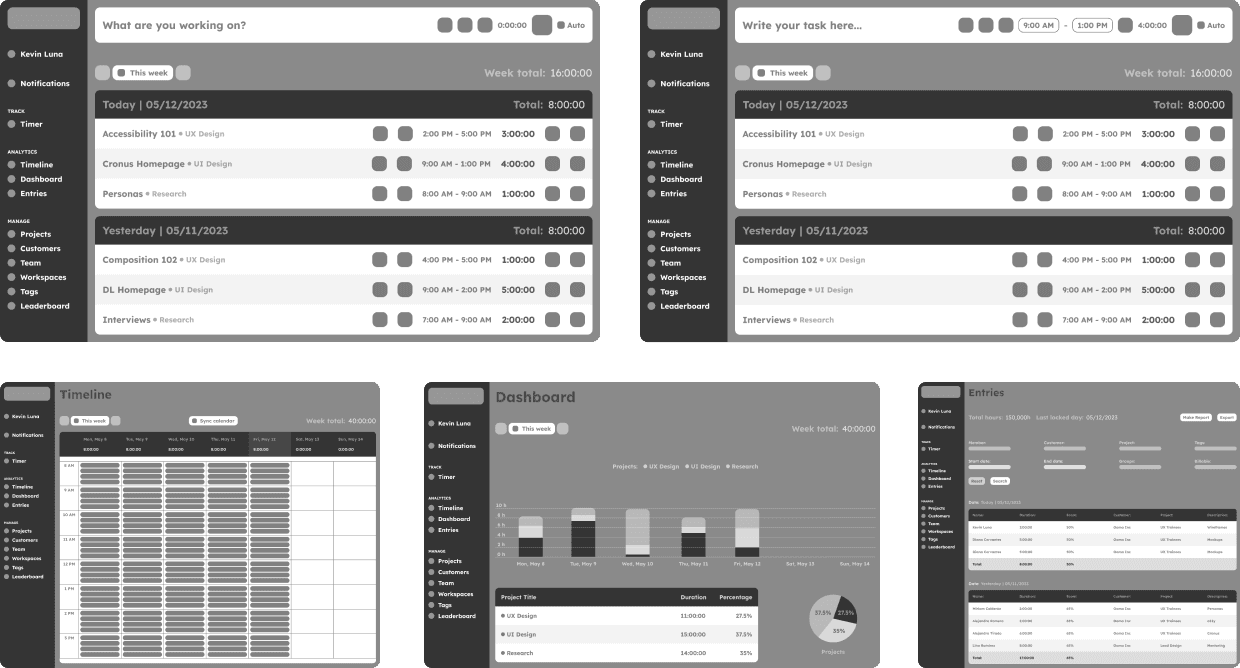
Mockups
Mockups
Mockups
After I structured the design and its content, I started to add other elements such as the color, typography, and graphic elements to add more context and bring the design to life.
I also worked on creating prototypes to test its functionality and usability regarding the new enhancements based on the pain points described during the research process.
Timer - Auto
Timer - Auto
Timer - Auto
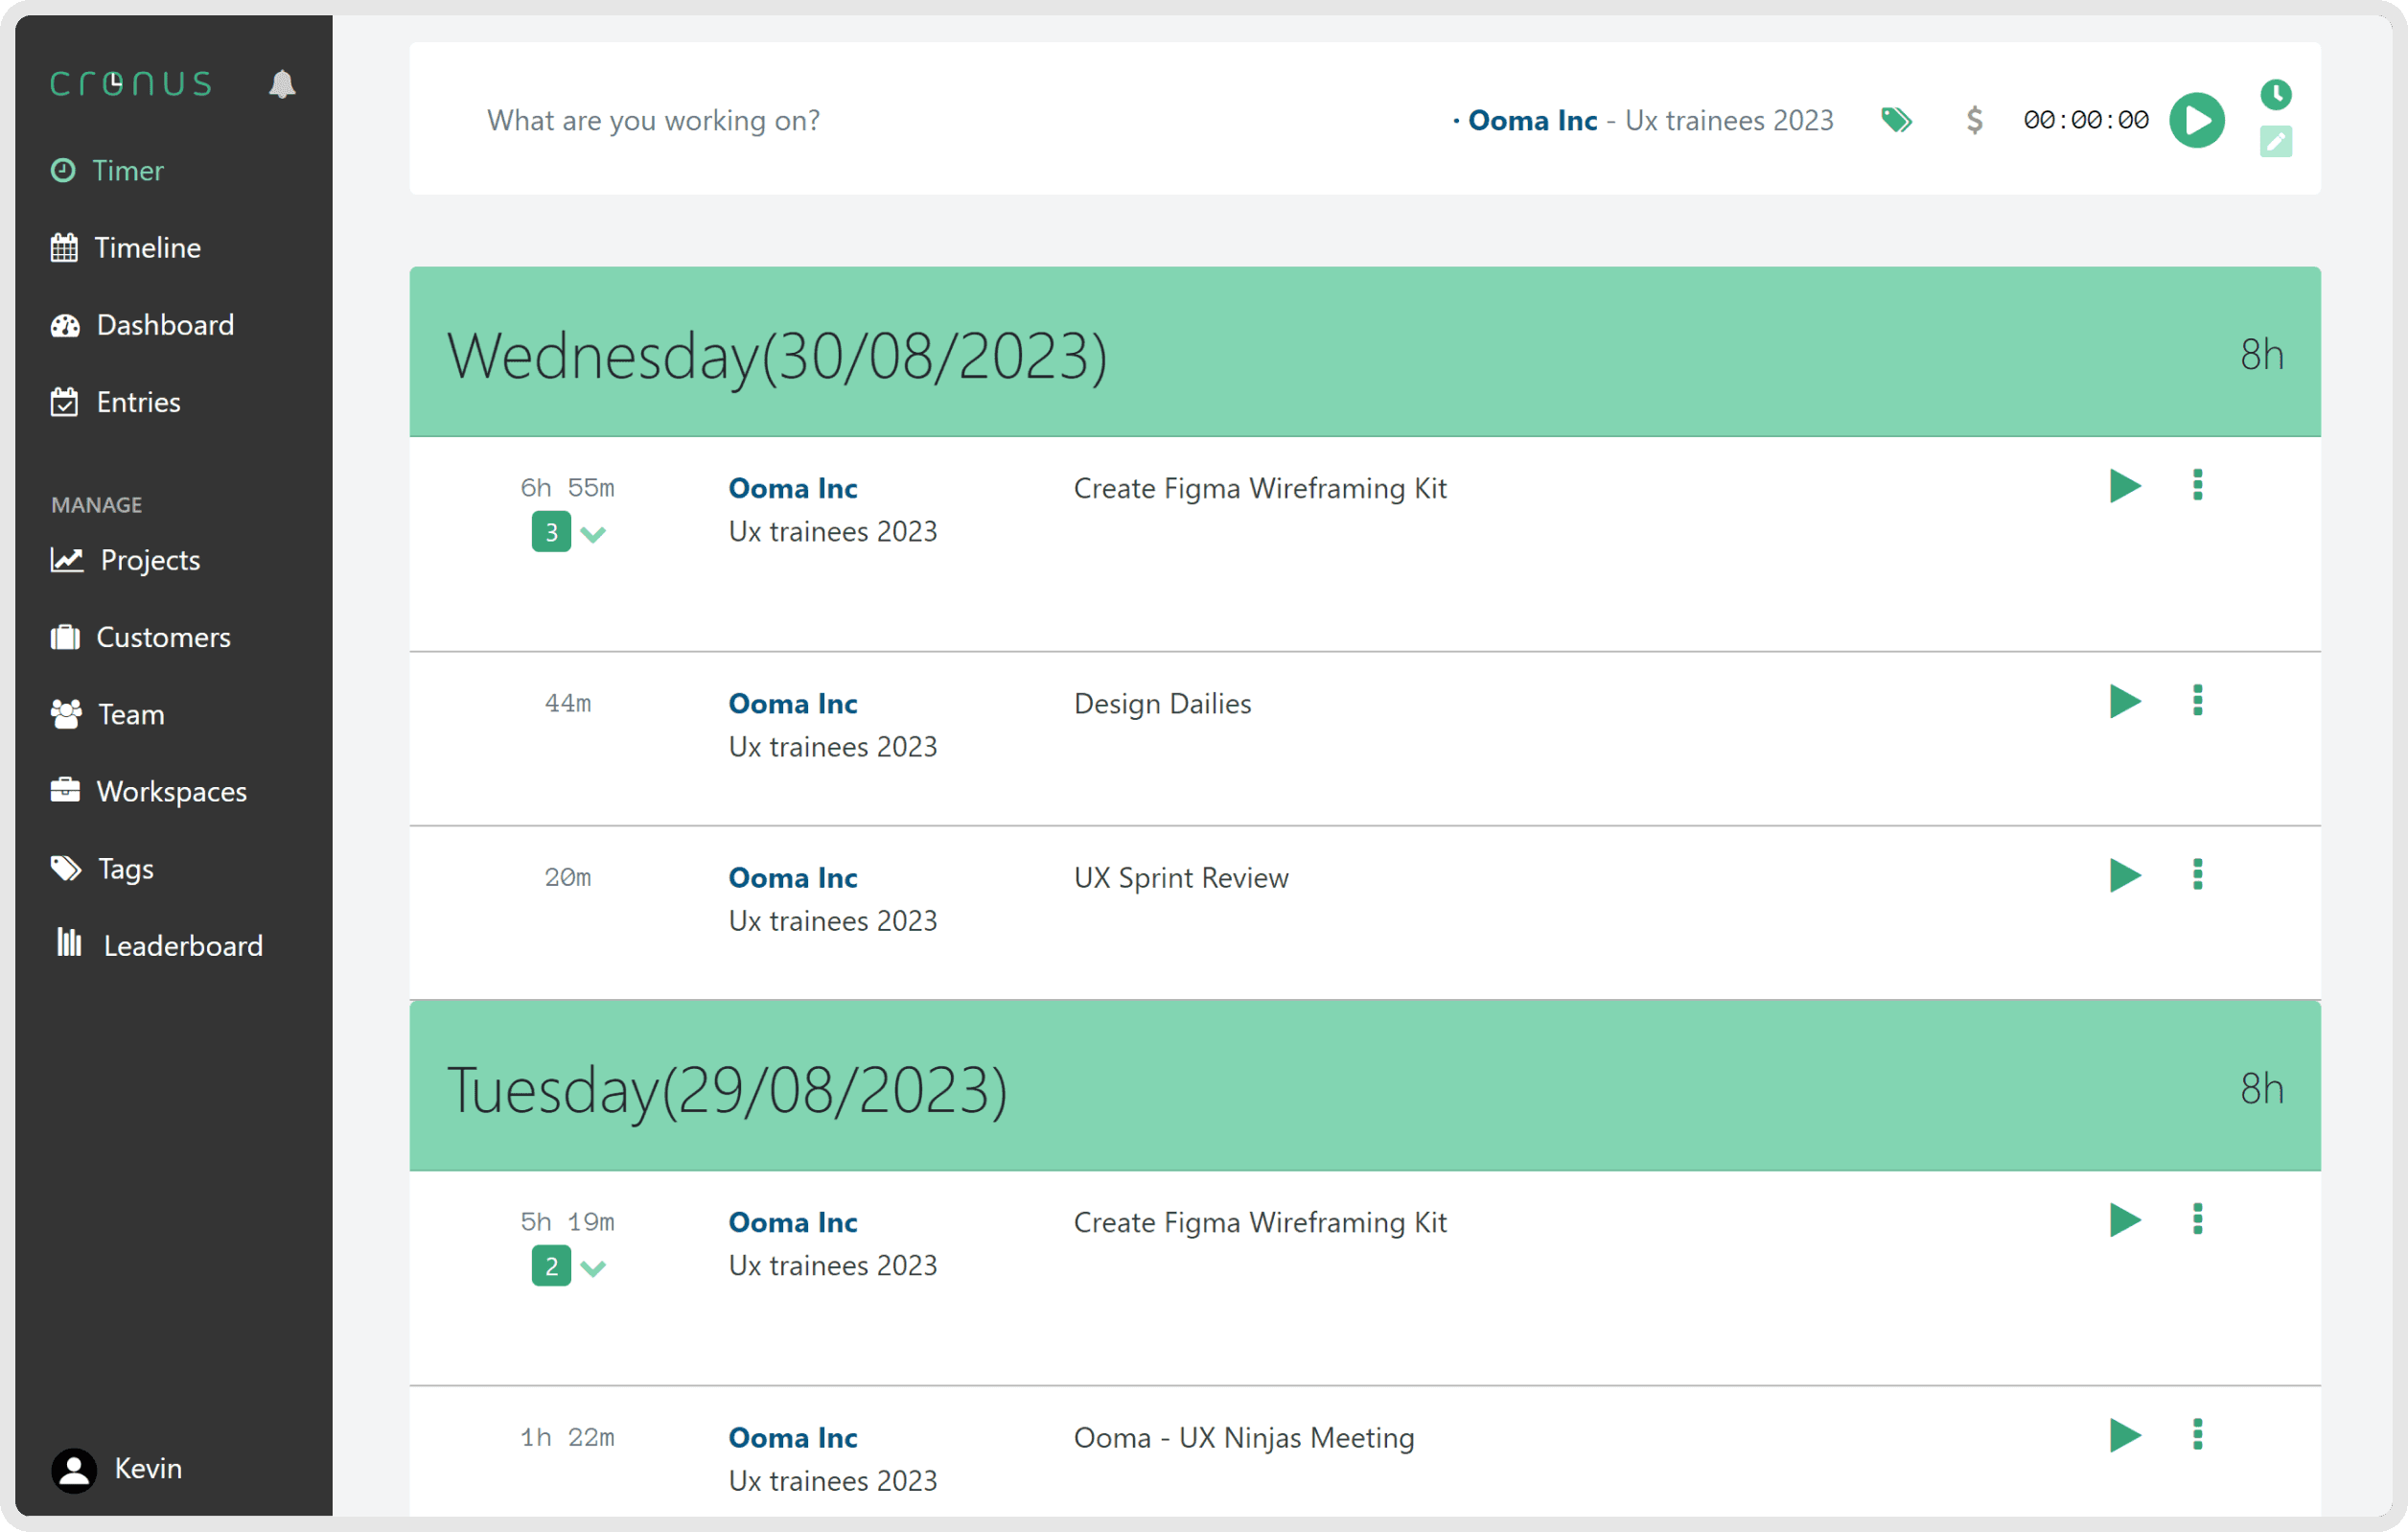
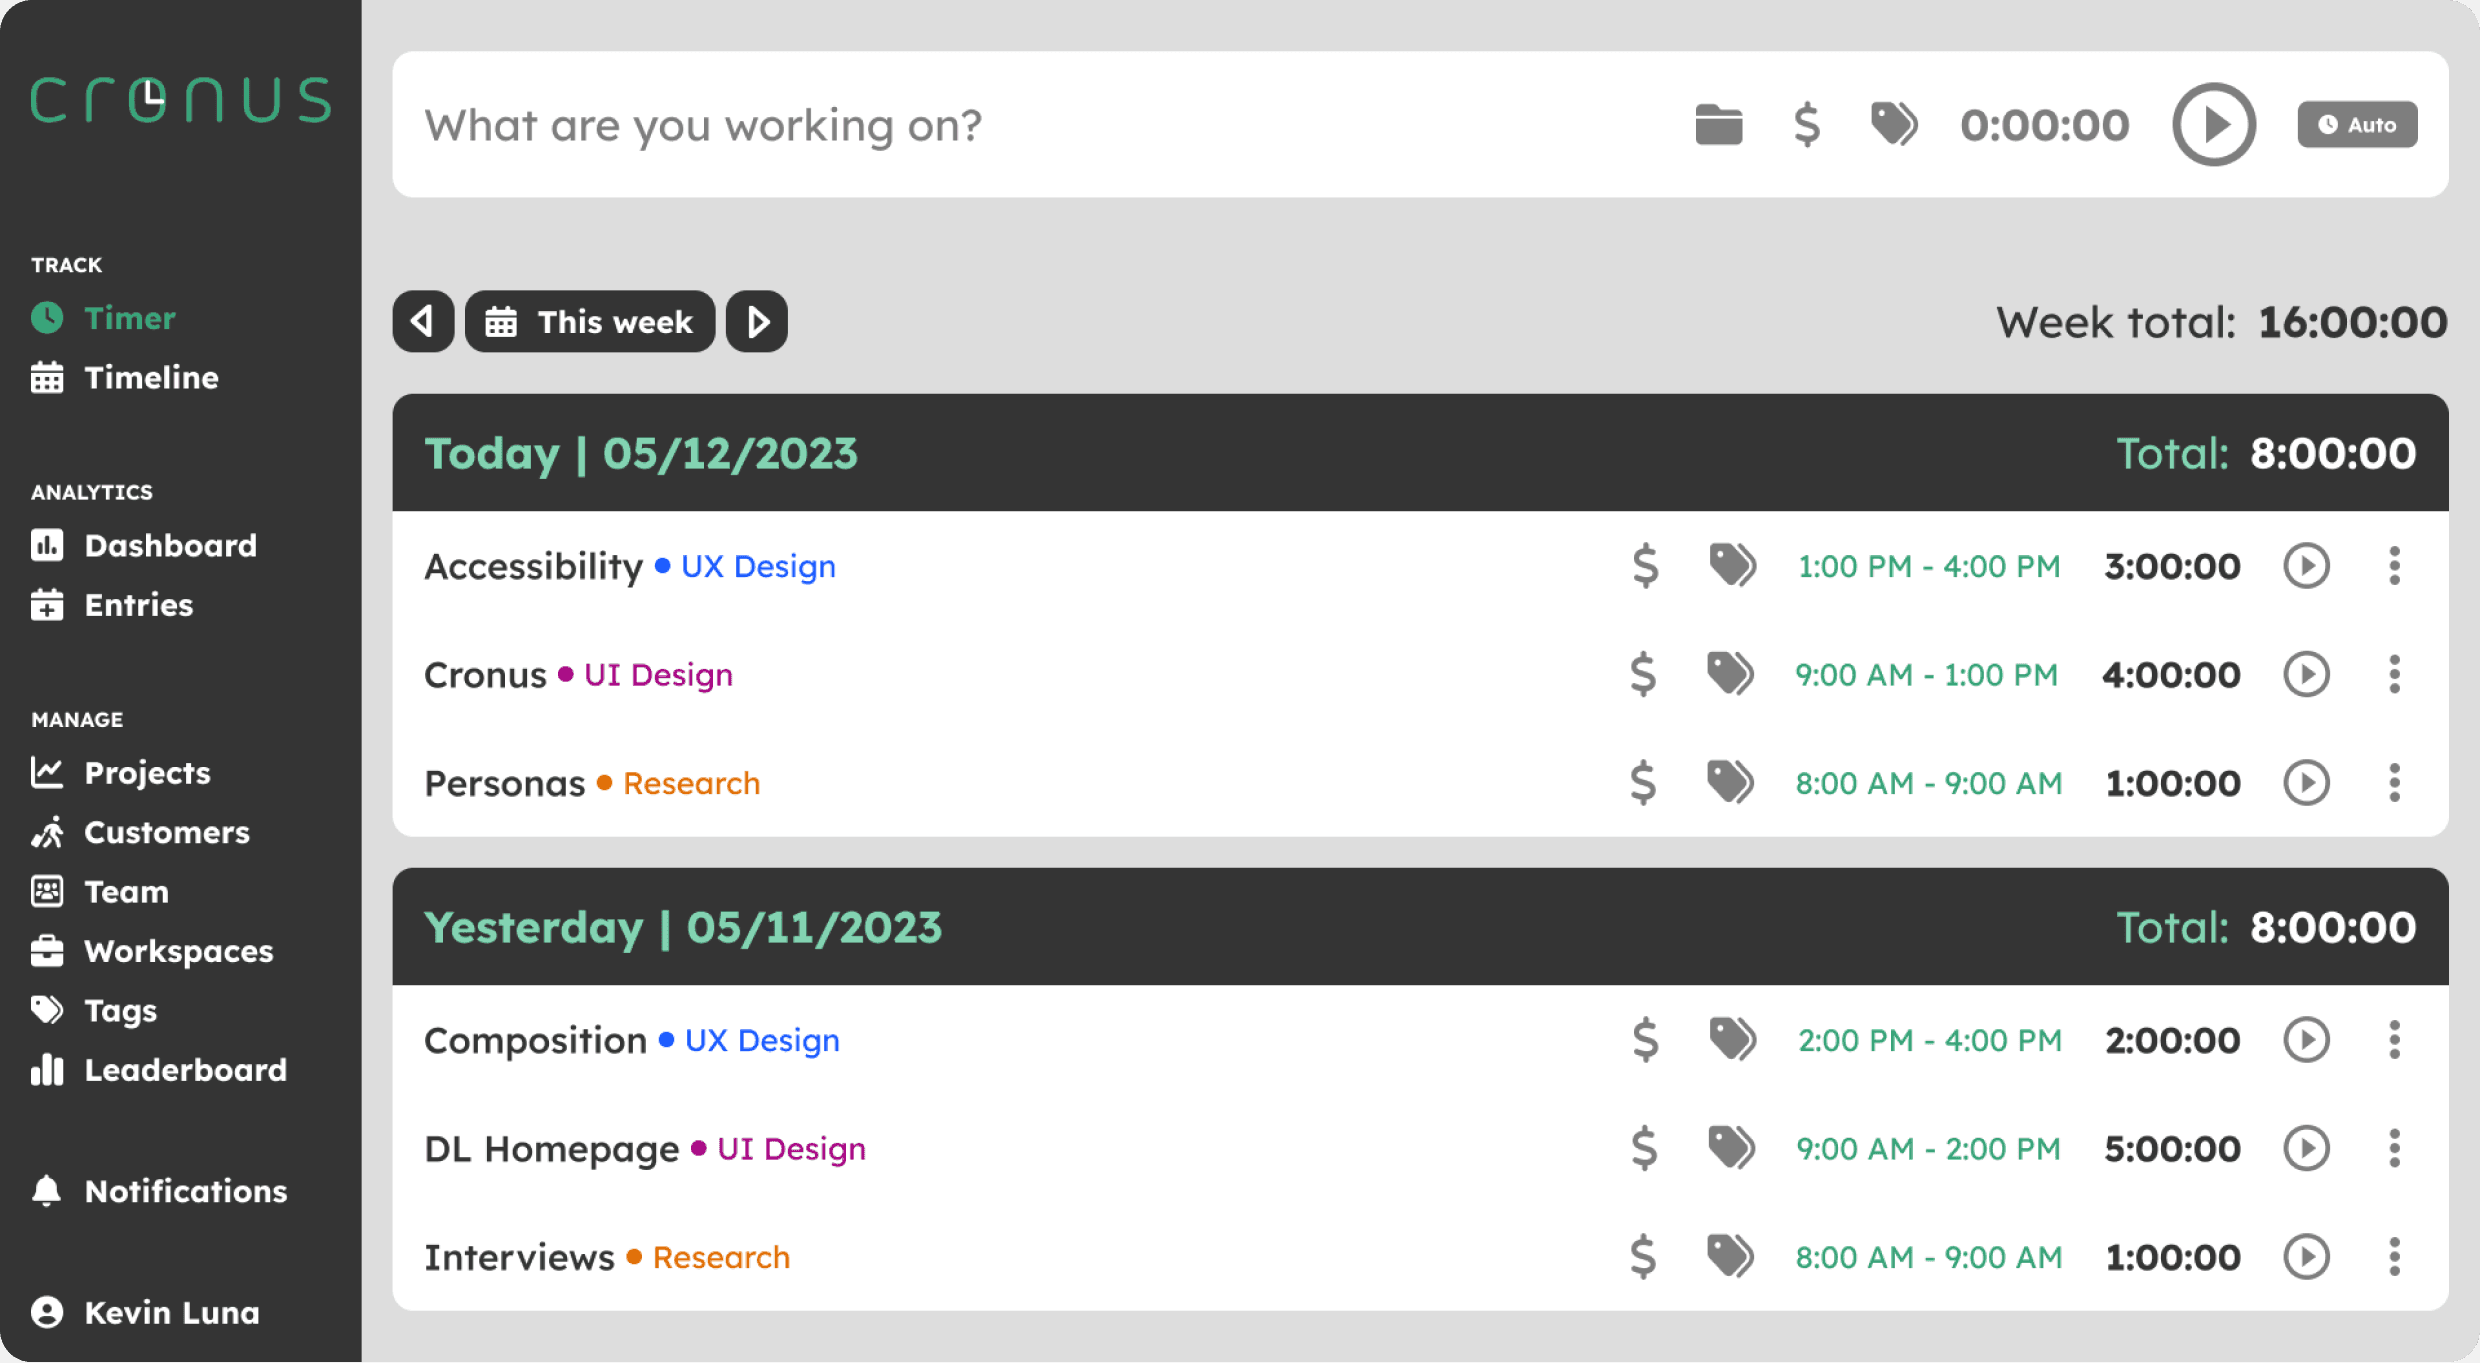
On this screen, the user can see the tasks they’ve done during the week, the time they’ve spent on each task, and the total amount per day and week. They can also change the view to a different week or day in particular as well as adding new entries and having a counter, category, if it’s monetized and tags to choose.
On this screen, the user can see the tasks they’ve done during the week, the time they’ve spent on each task, and the total amount per day and week. They can also change the view to a different week or day in particular as well as adding new entries and having a counter, category, if it’s monetized and tags to choose.
Timer - Manual
Timer - Manual
Timer - Manual
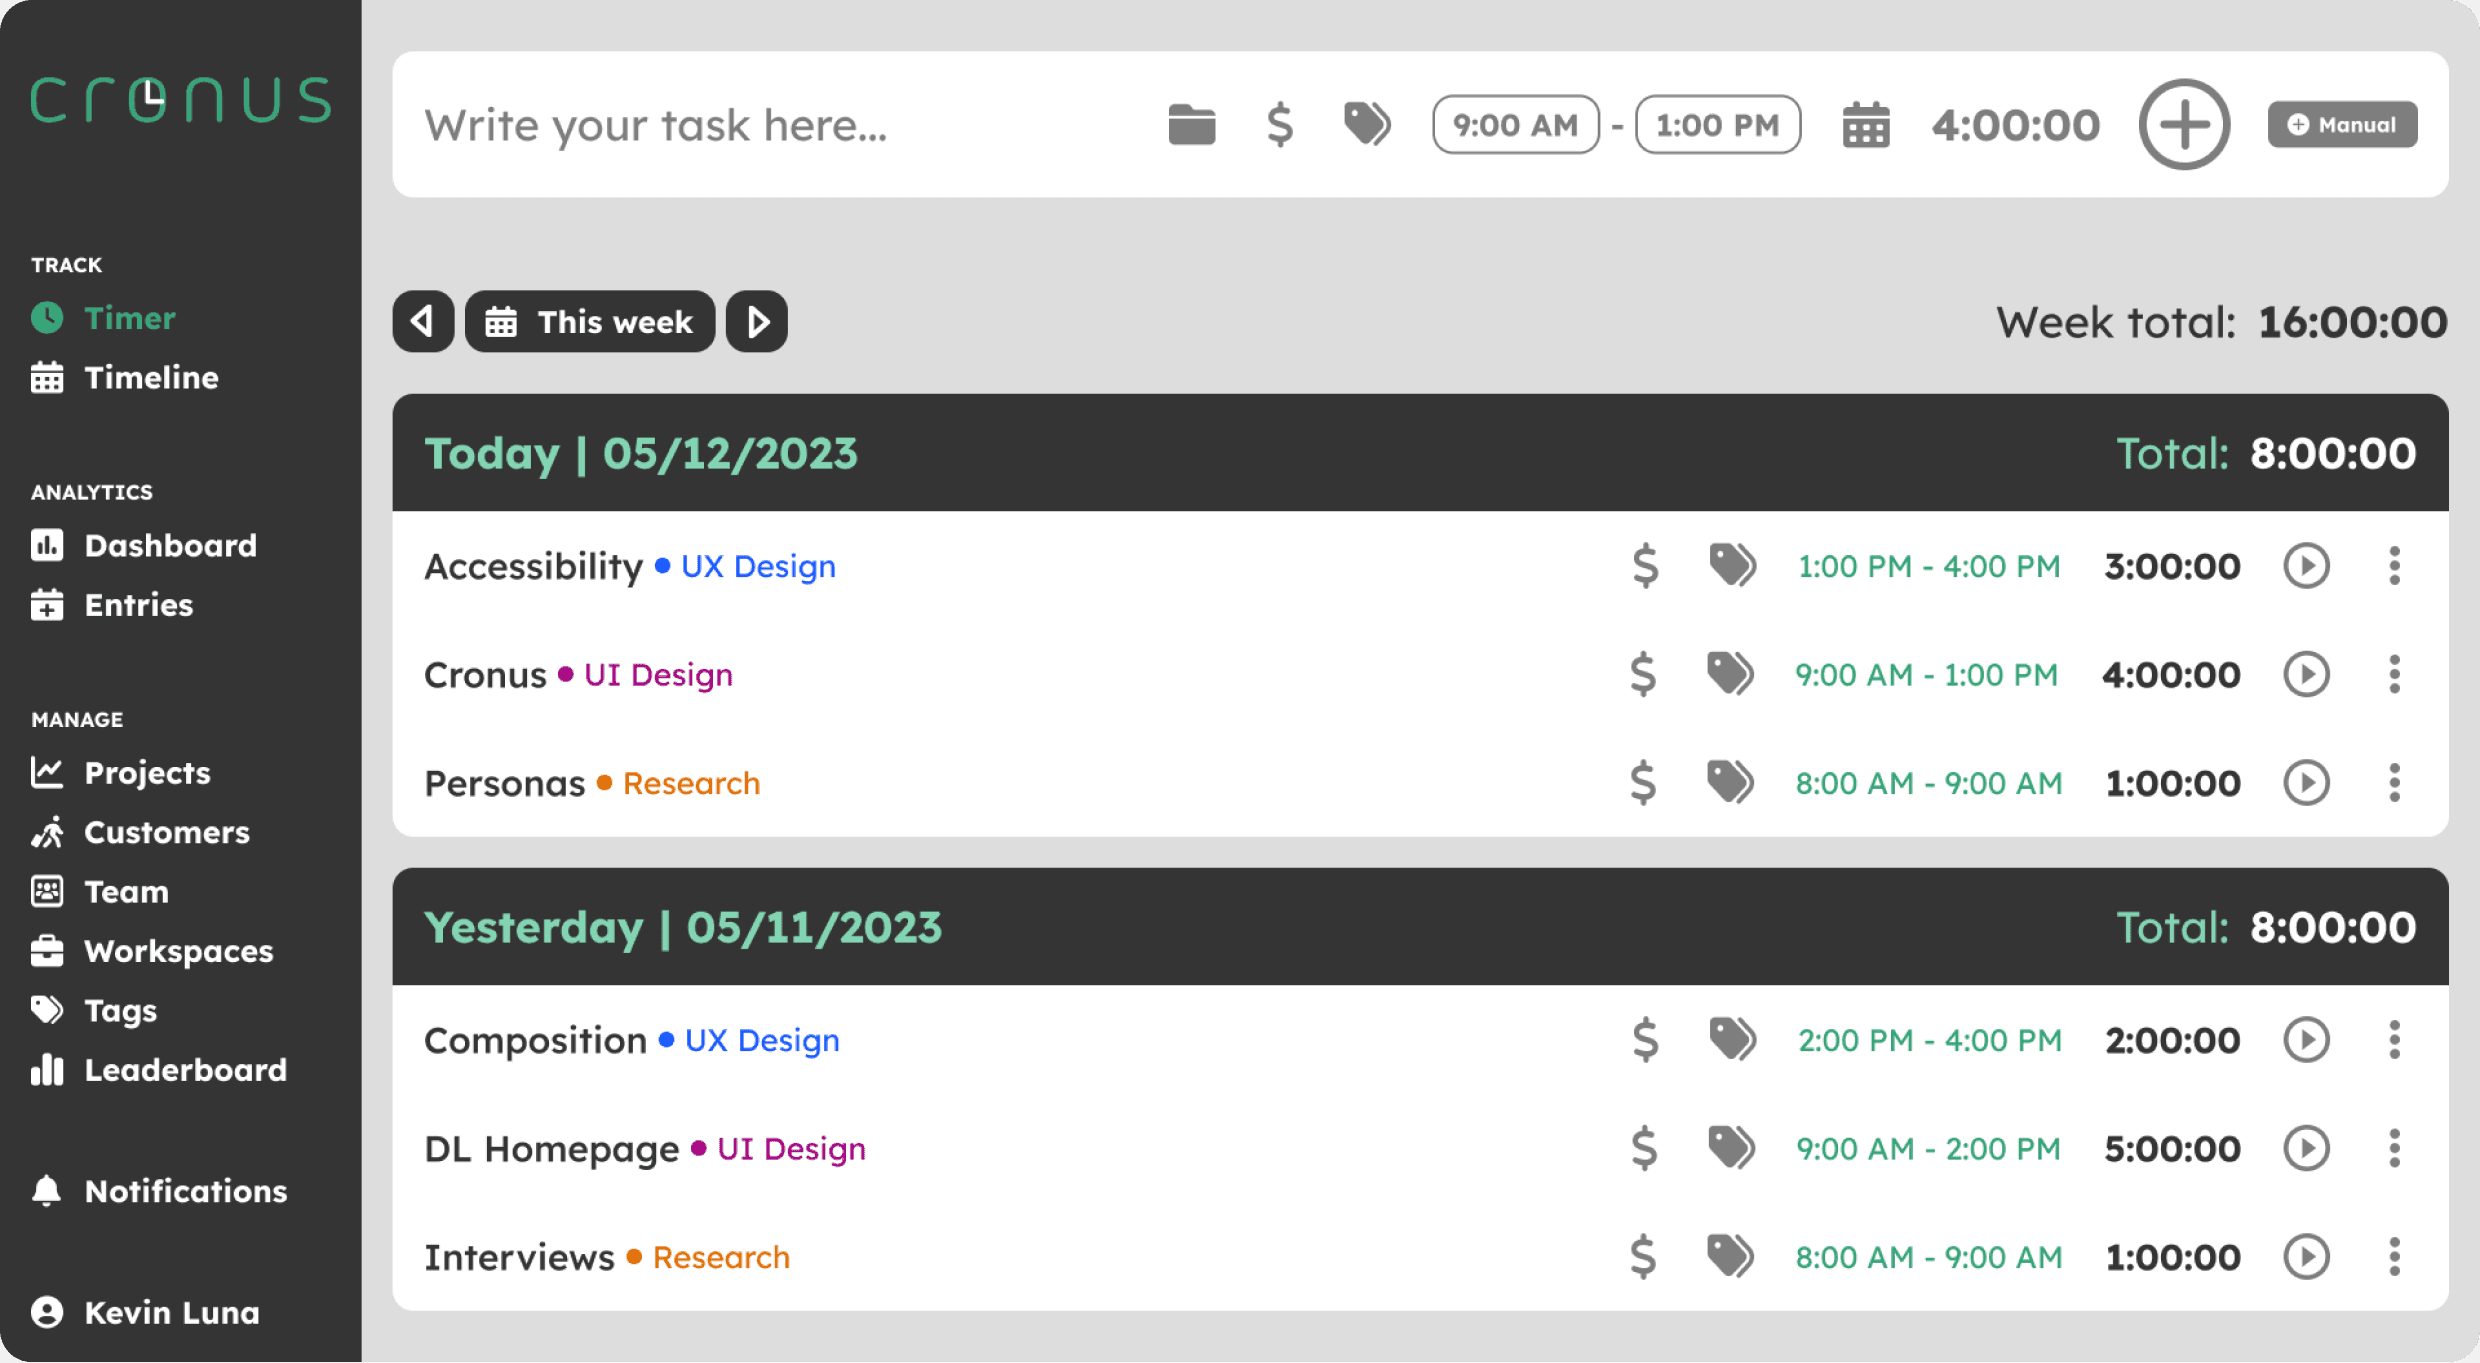
The difference in this screen is that the user can add an entry that they may have forgotten to add. They can manually set the time they took to perform it or the timeframe they took.
The difference in this screen is that the user can add an entry that they may have forgotten to add. They can manually set the time they took to perform it or the timeframe they took.
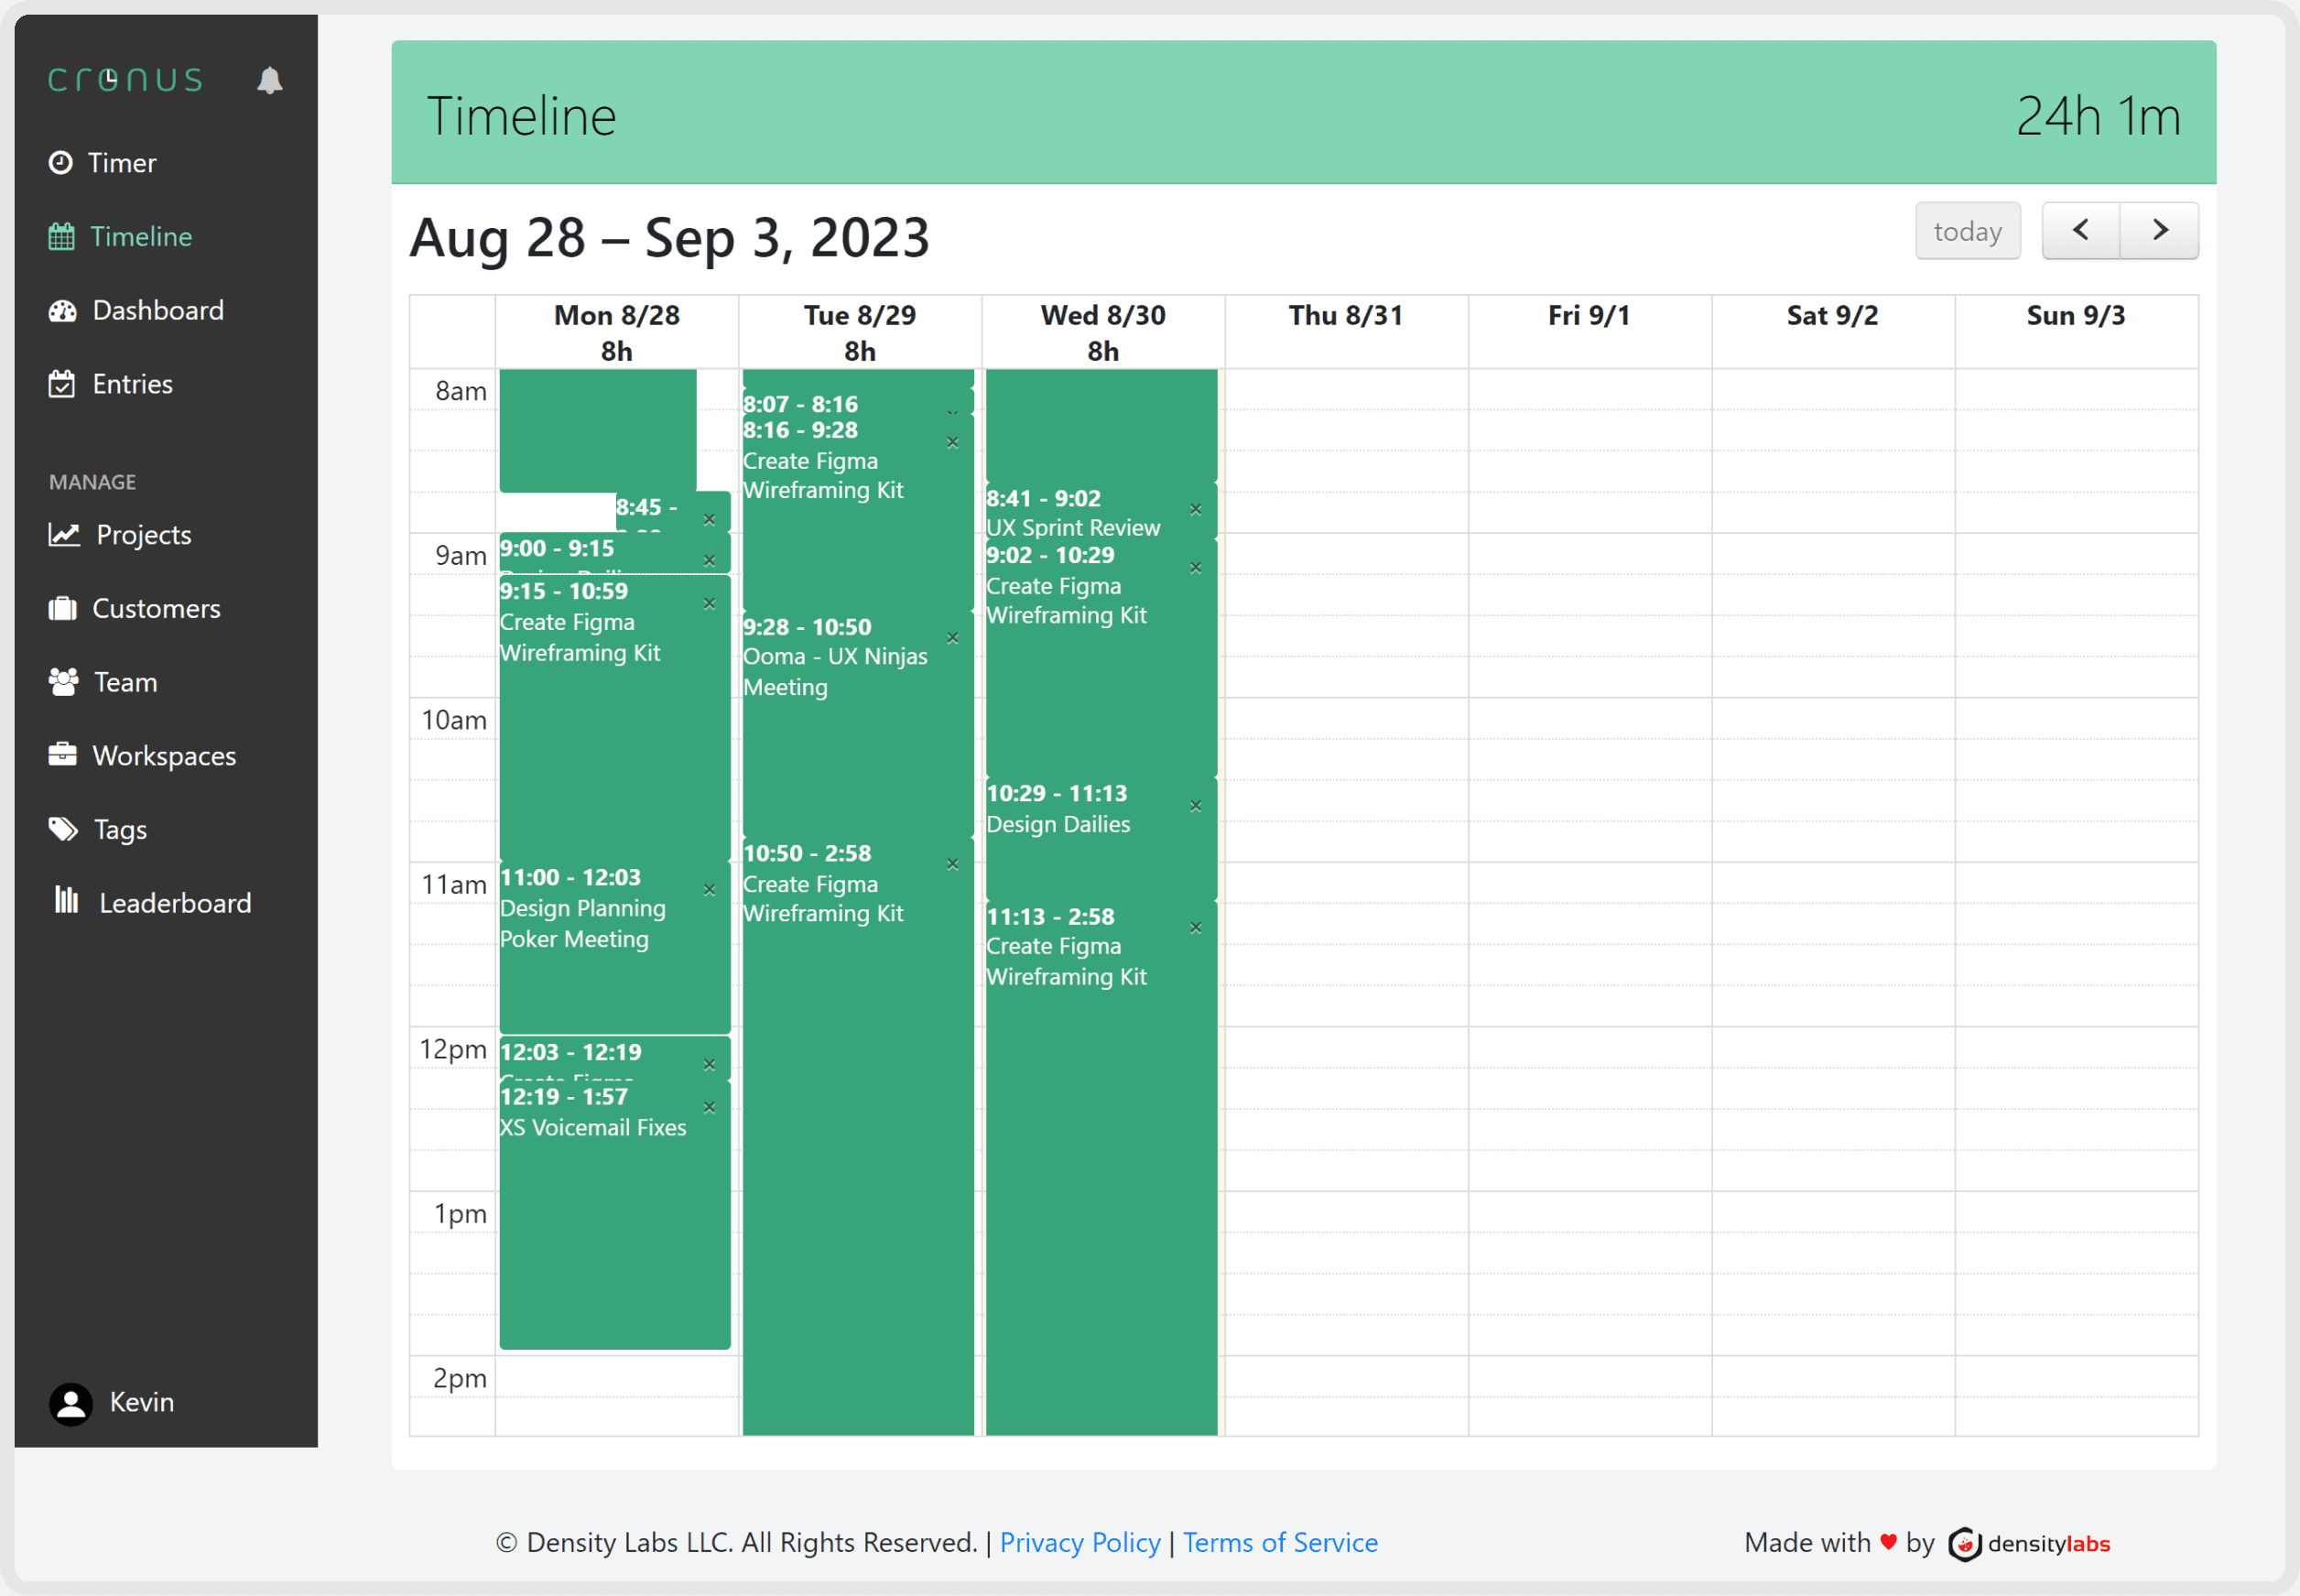
Timeline
Timeline
Timeline
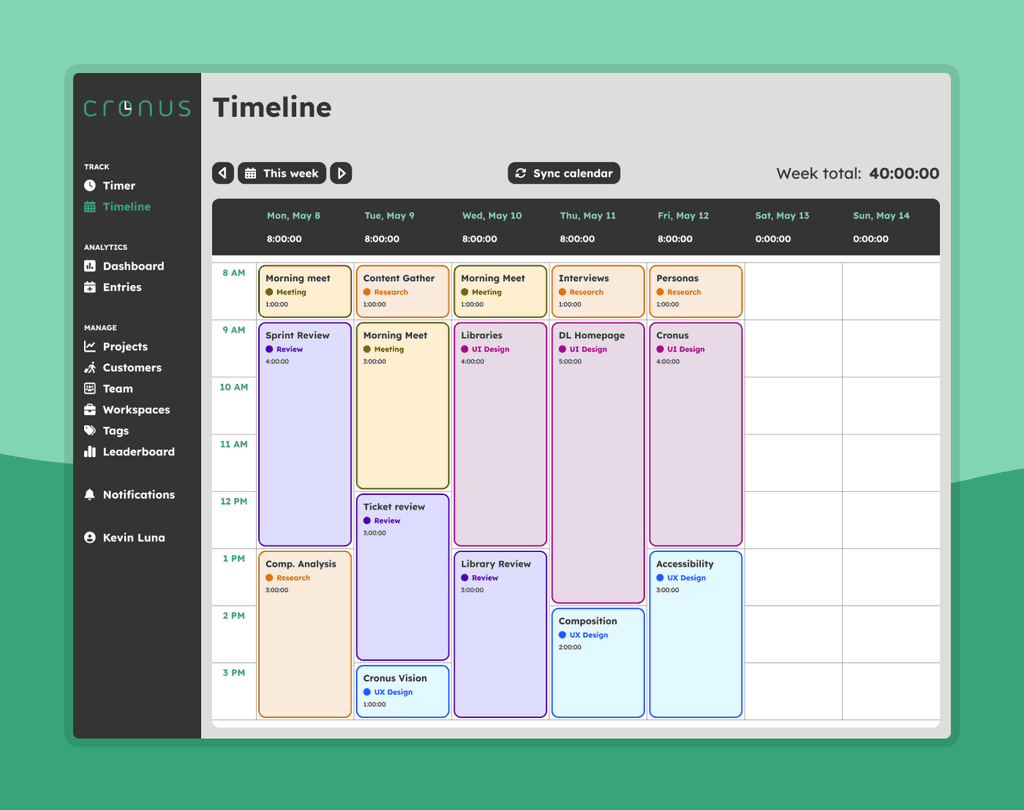
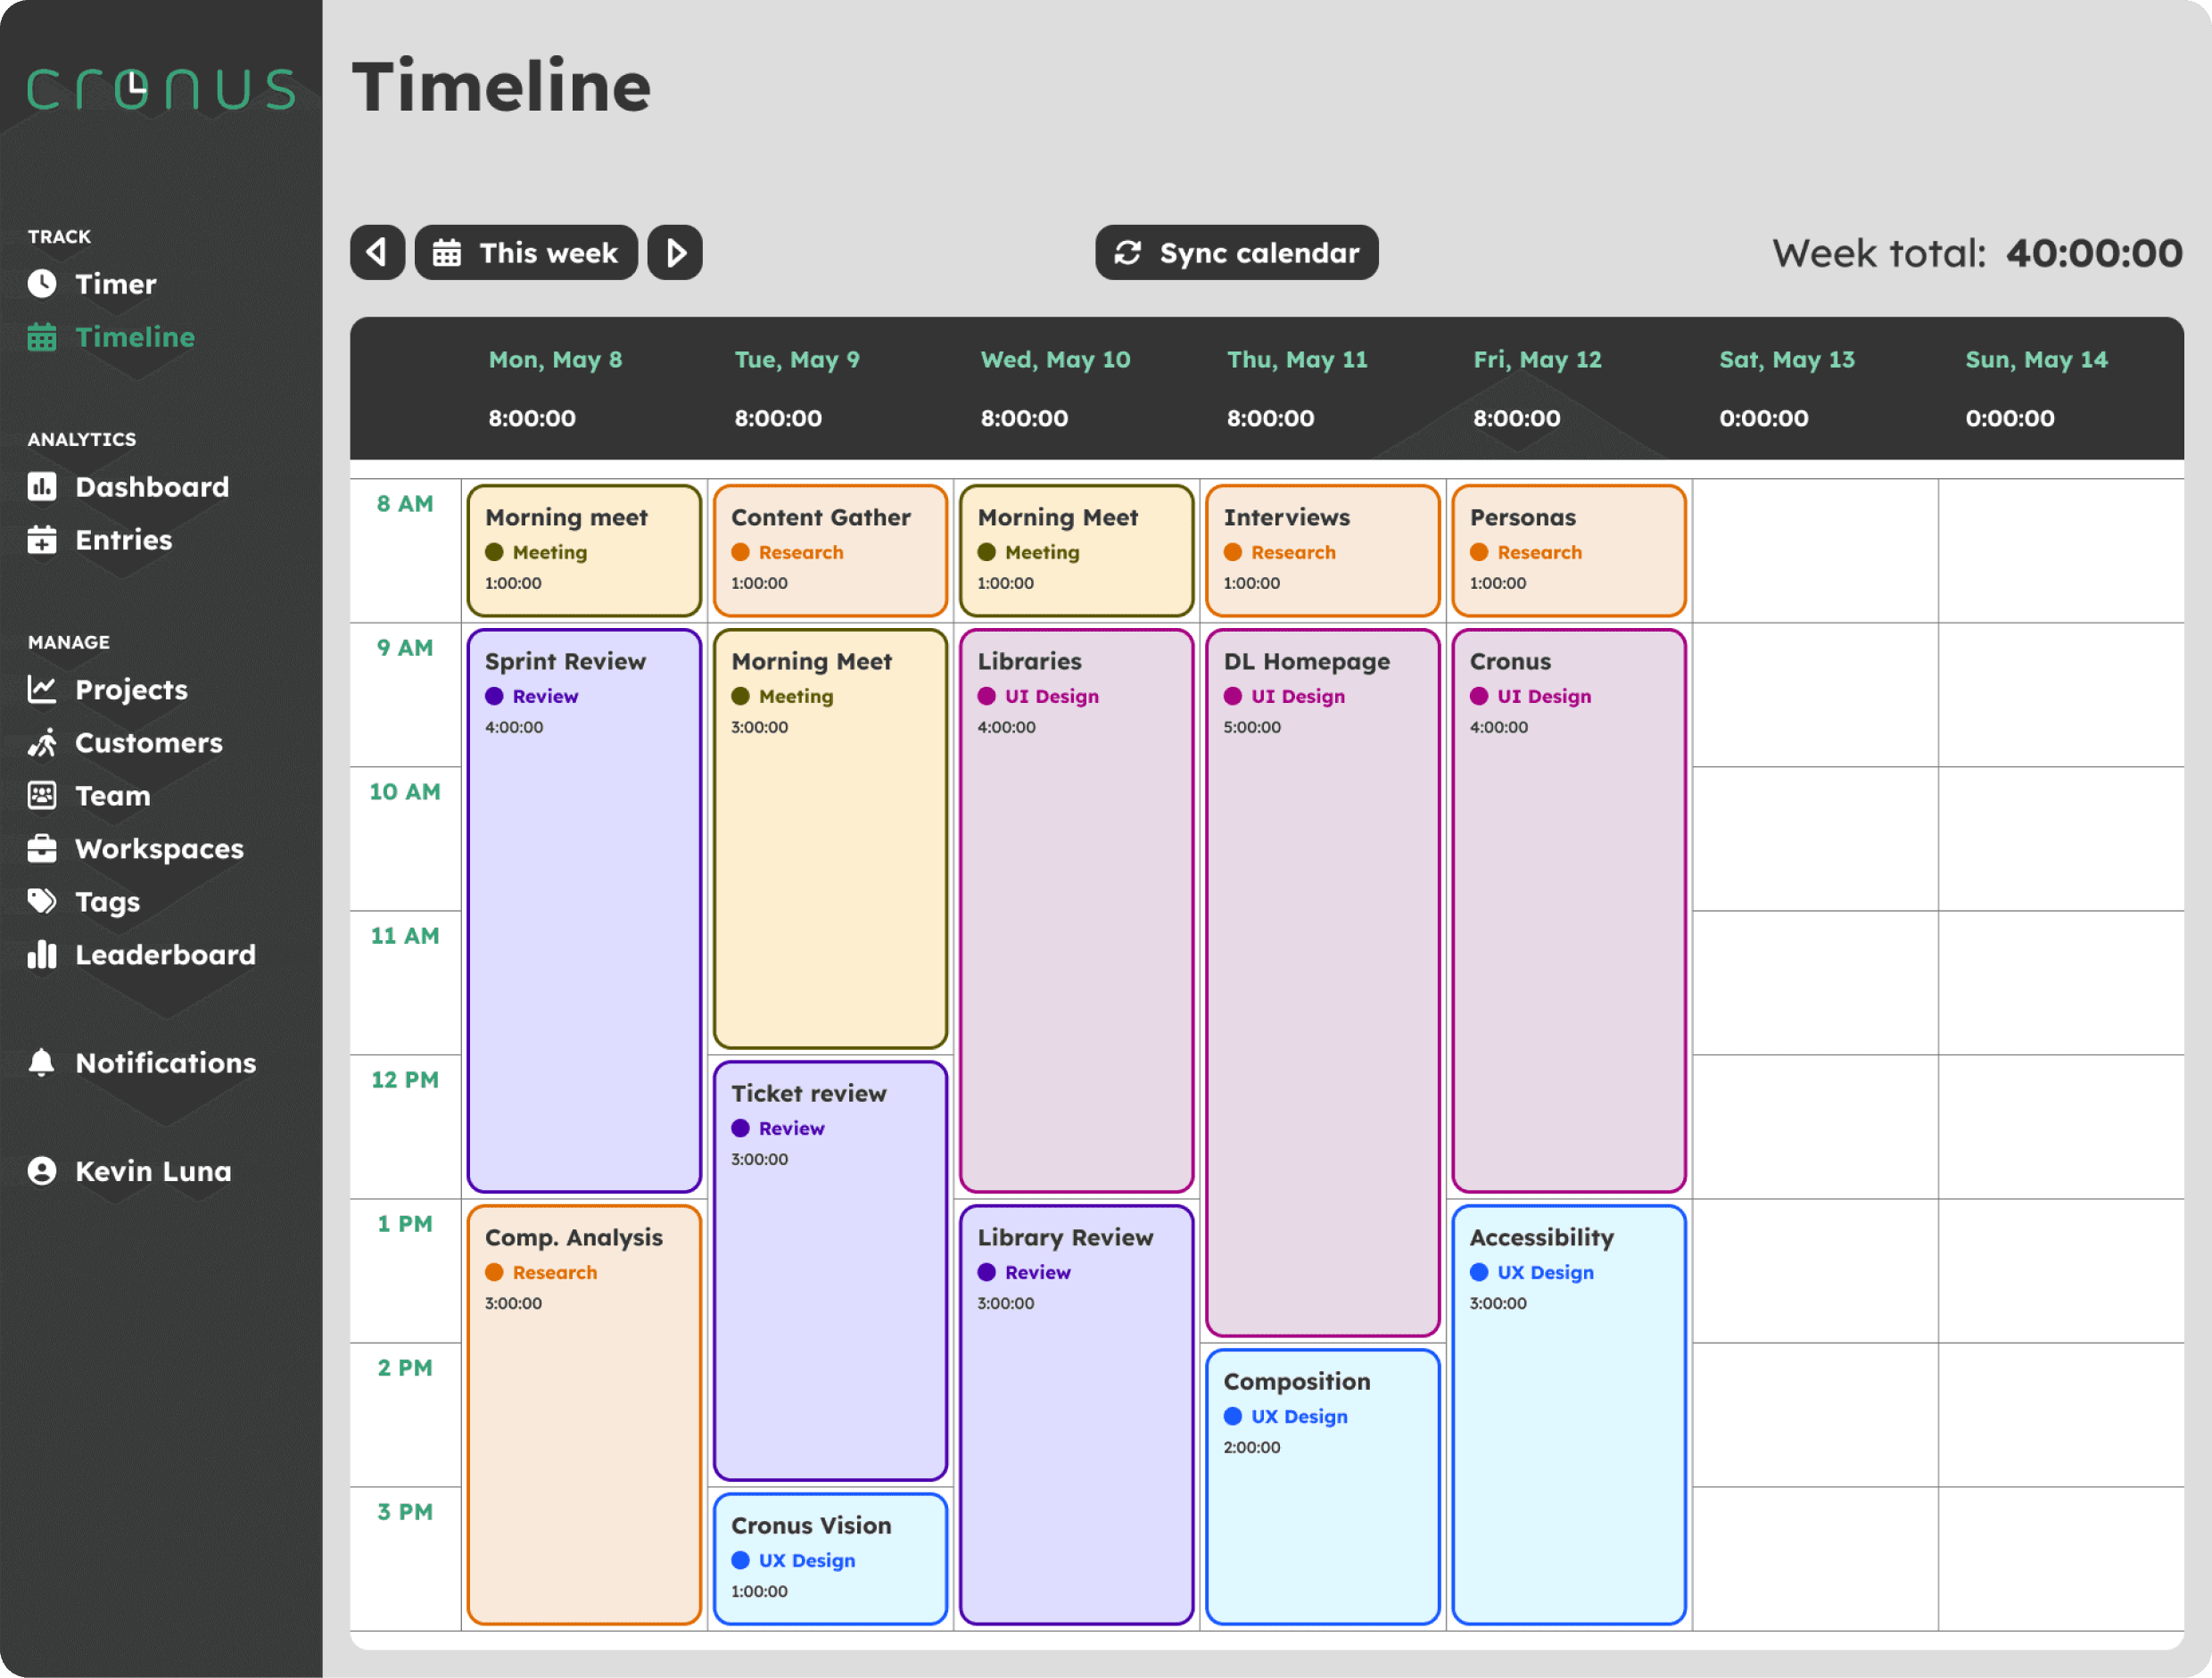
On this view the user can see the tasks they’ve performed in a calendar view and select them without any trouble. They have colors to categorize them as well as the ability to change between different weeks and synchronize different calendars they use to add recurrent meetings.
On this view the user can see the tasks they’ve performed in a calendar view and select them without any trouble. They have colors to categorize them as well as the ability to change between different weeks and synchronize different calendars they use to add recurrent meetings.
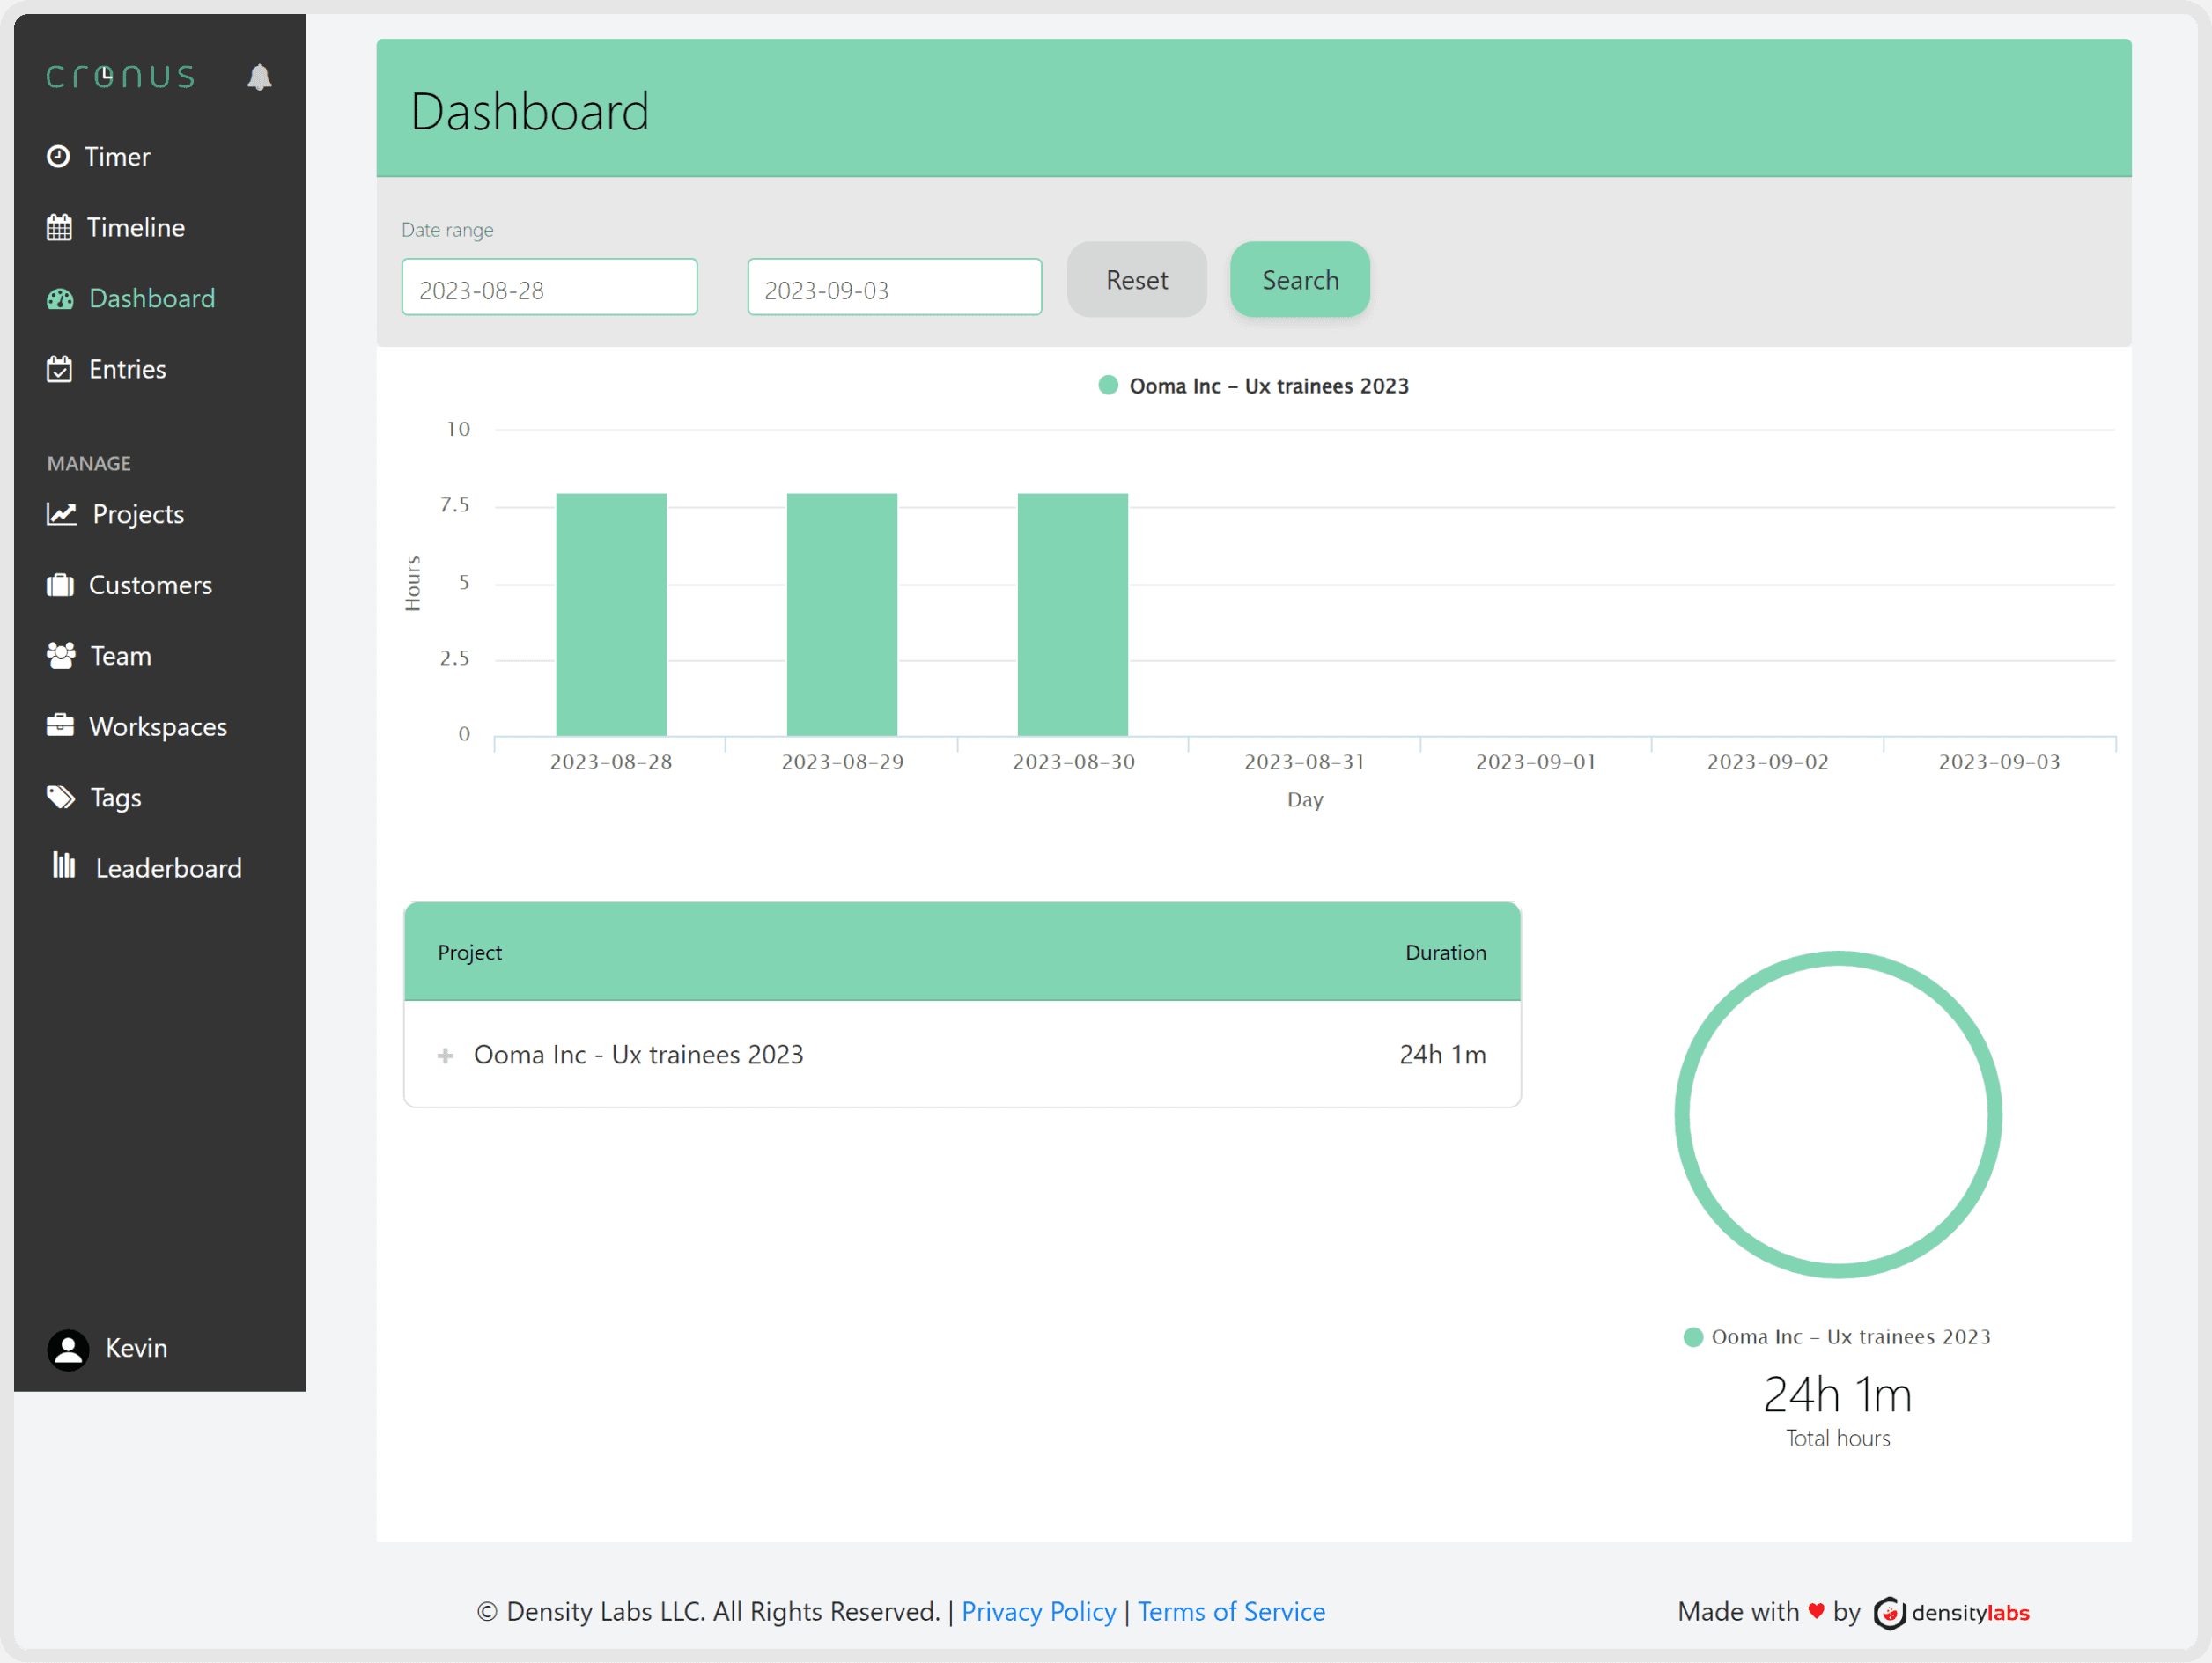
Dashboard
Dashboard
Dashboard
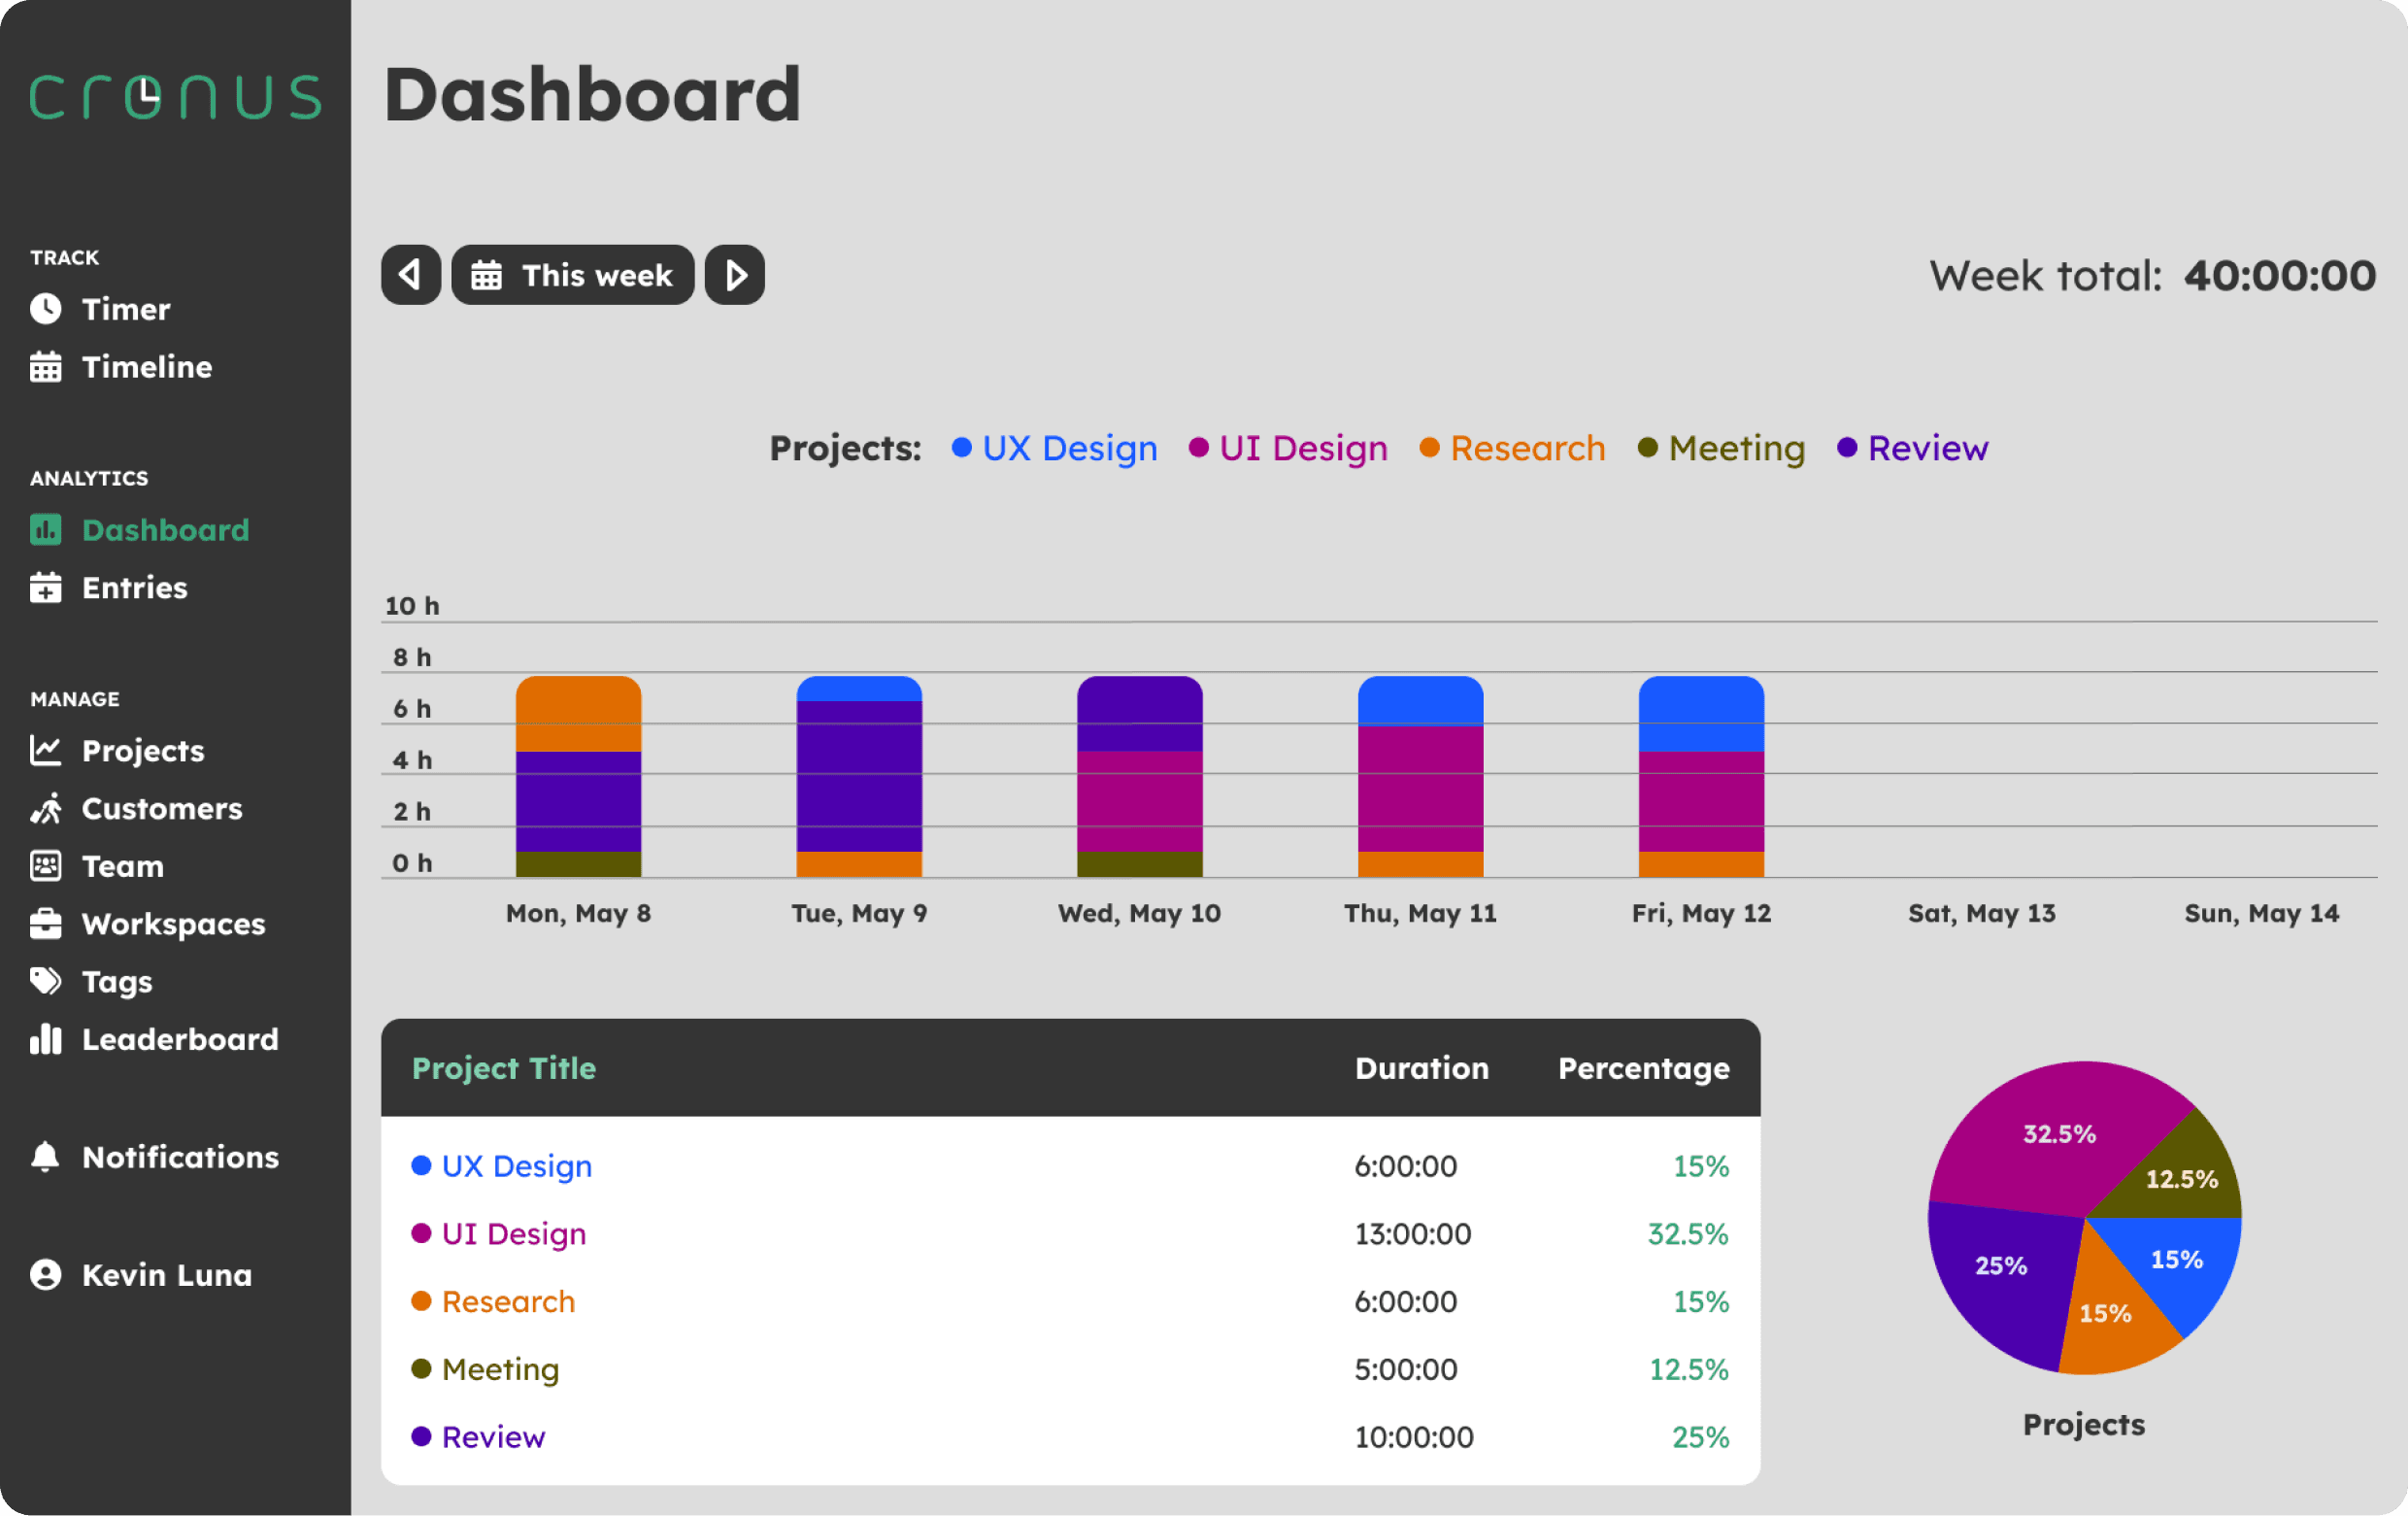
Here the user can review the percentage of time they’ve spent in different types of tasks. Having different types of colors helps to visualize where they’ve spent more time and review if that’s the amount of time they want to spend on those categories.
Here the user can review the percentage of time they’ve spent in different types of tasks. Having different types of colors helps to visualize where they’ve spent more time and review if that’s the amount of time they want to spend on those categories.
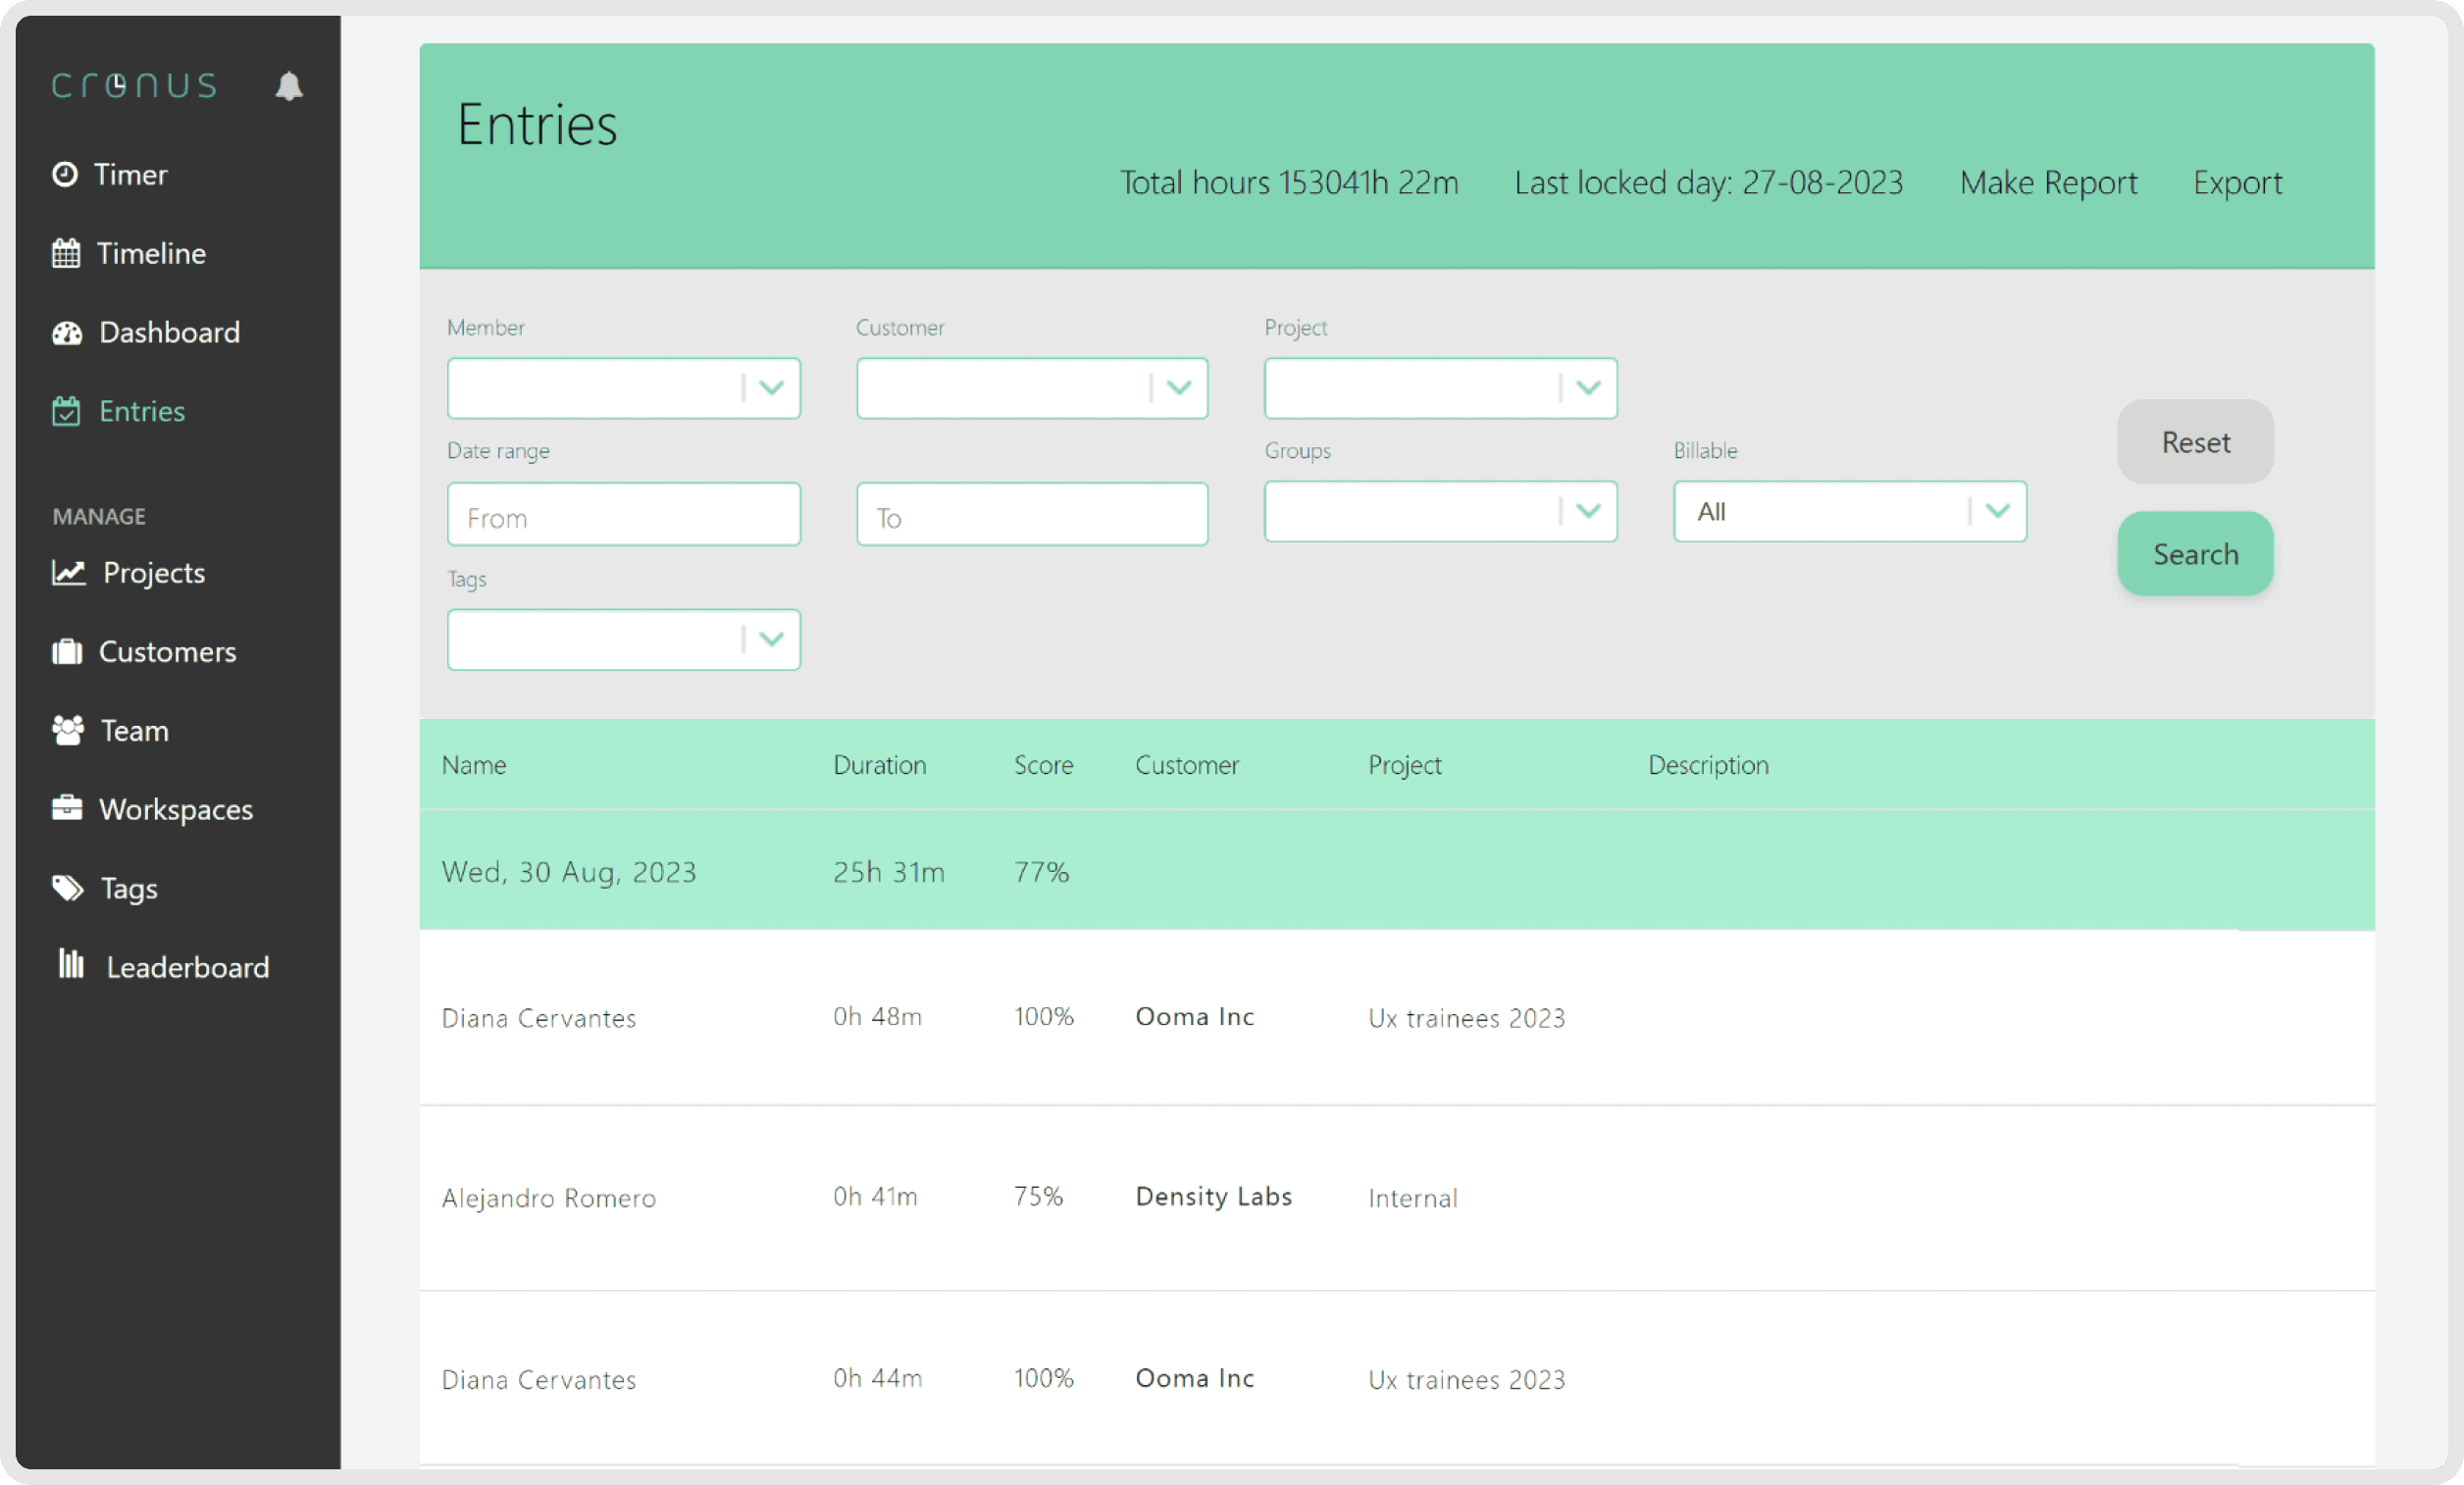
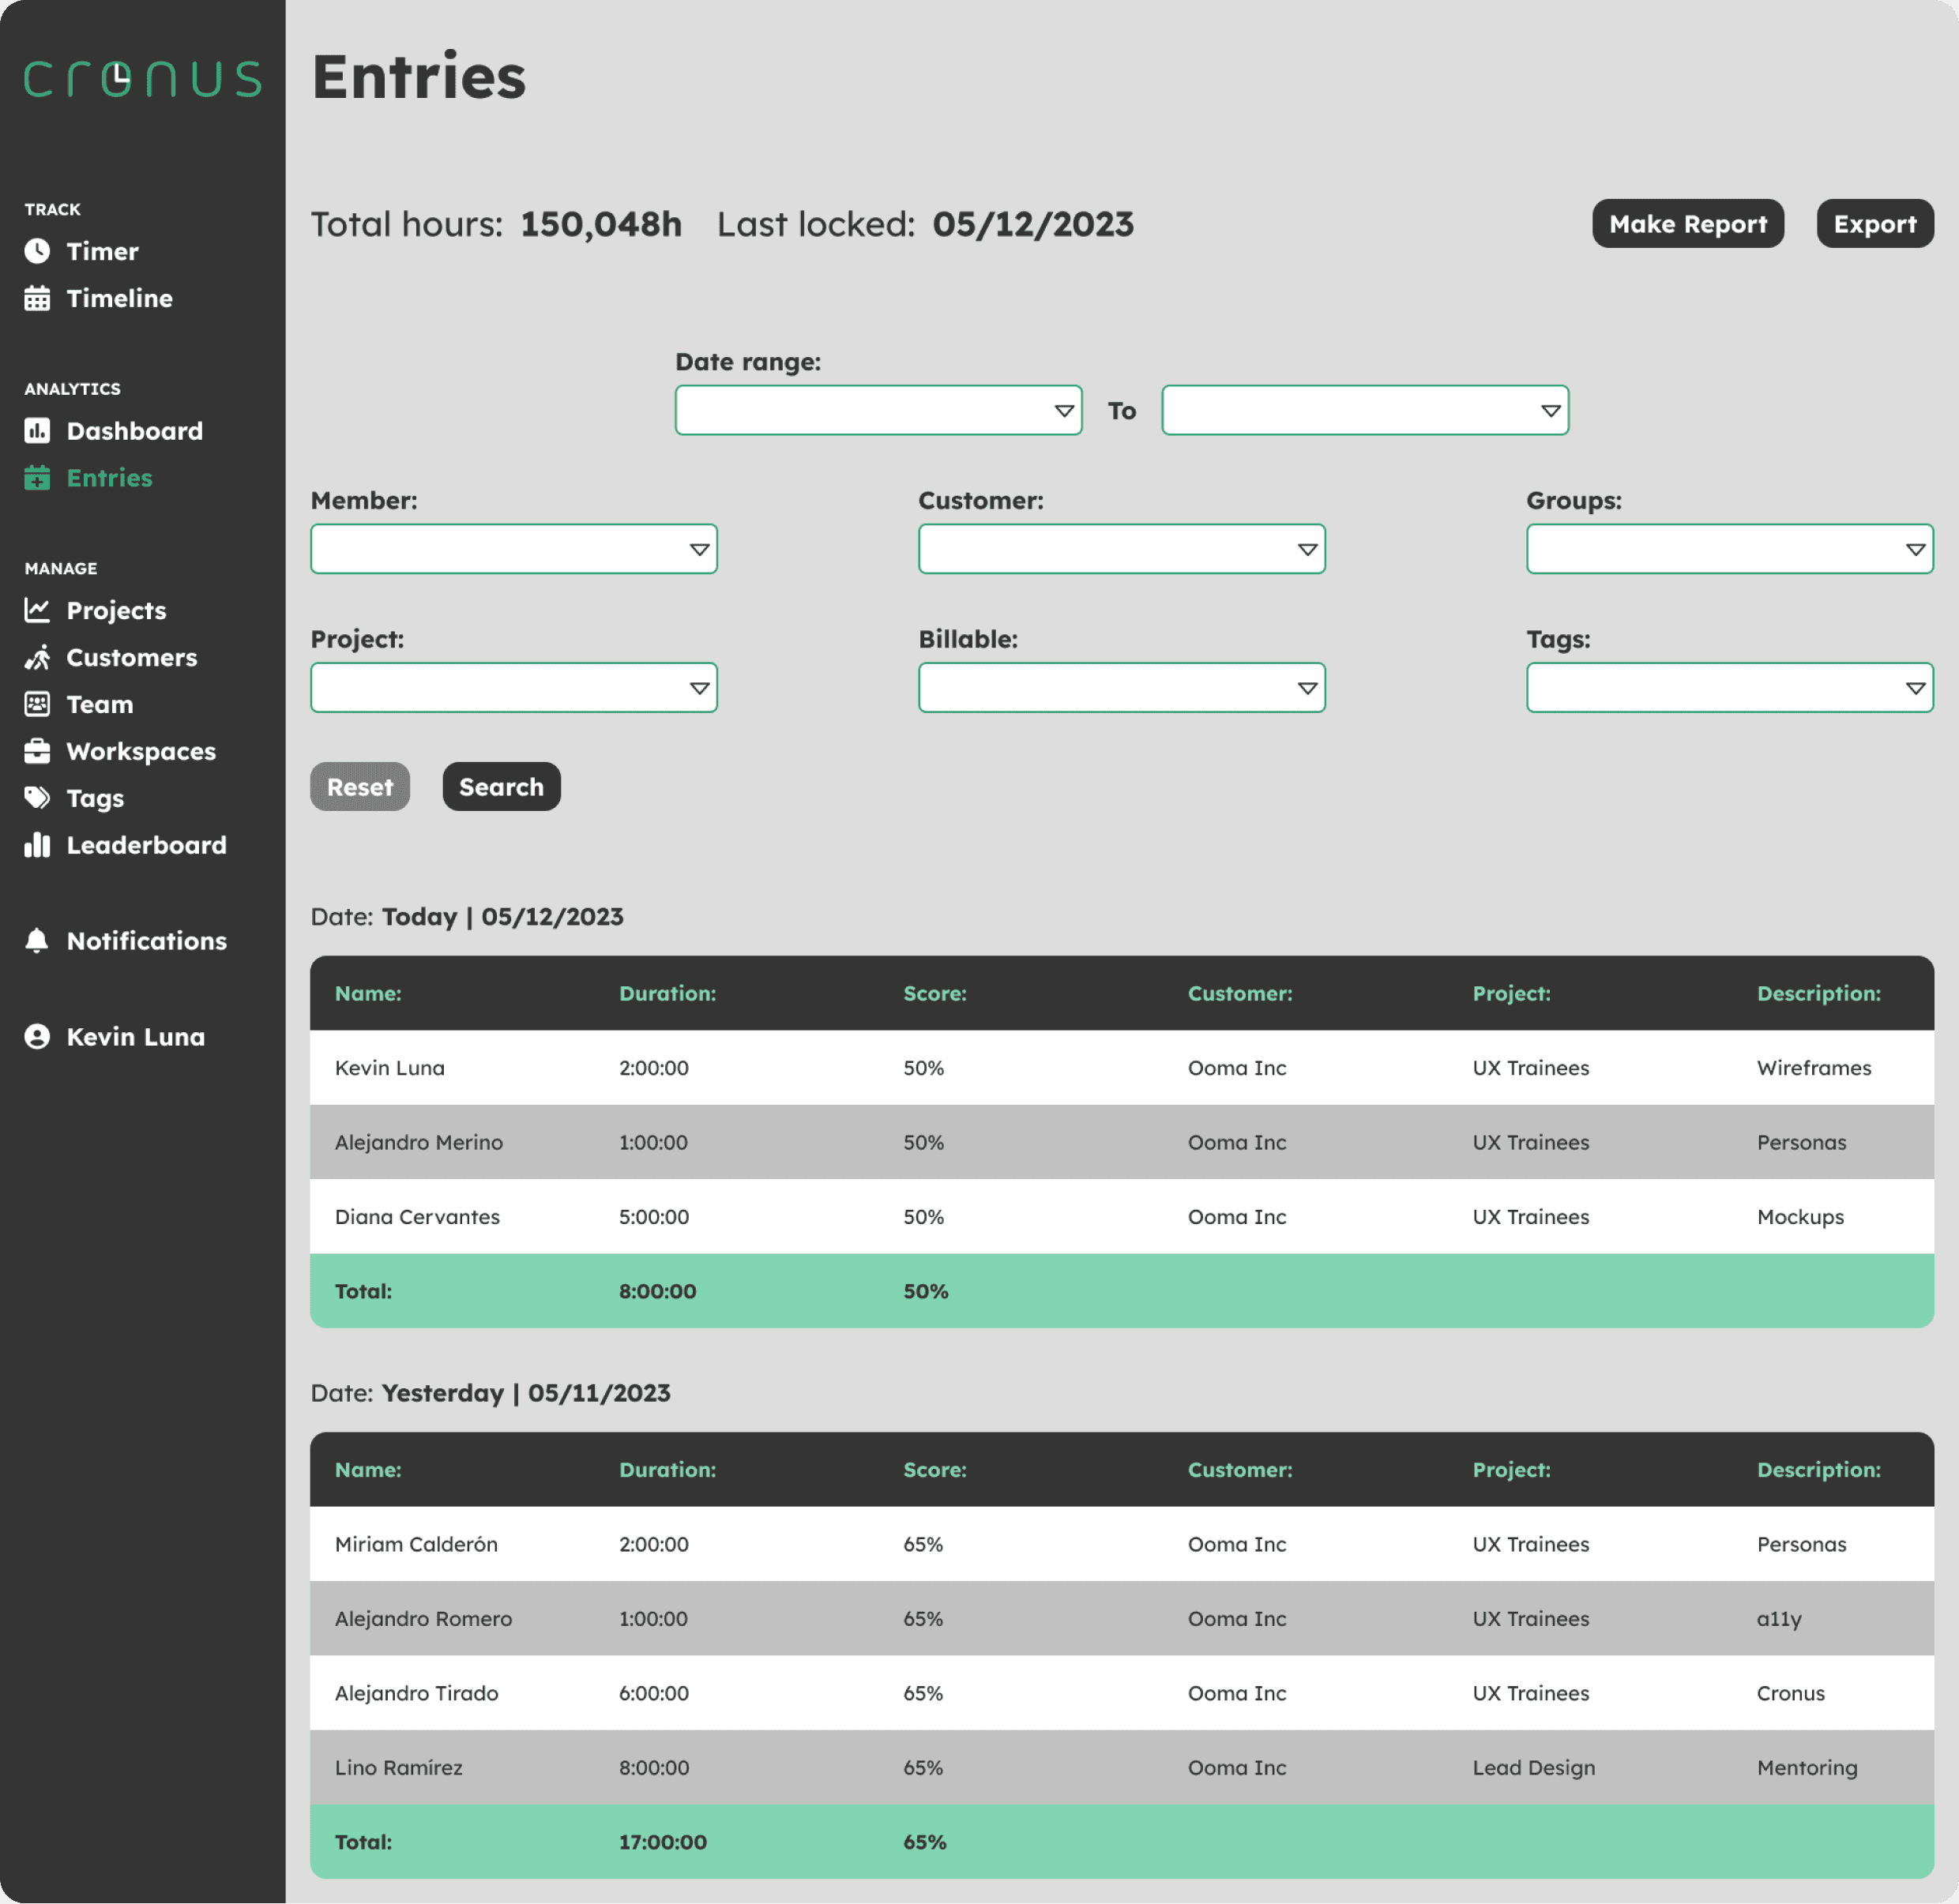
Entries
Entries
Entries
In this view, the user can check the history of all of their entries and apply certain filters to review by different categories. They can also review entries of co-workers to understand where different teams are spending most of their time.
In this view, the user can check the history of all of their entries and apply certain filters to review by different categories. They can also review entries of co-workers to understand where different teams are spending most of their time.
Conclusion
Conclusion
Conclusion
This project helped me understand more concepts about the UX part of the design process and refine my UI skills.
Working on this improved my development as a professional in this industry and motivated me to keep growing.
This project helped me understand more concepts about the UX part of the design process and refine my UI skills.
Working on this improved my development as a professional in this industry and motivated me to keep growing.
Other projects
Other projects
Other projects
View other projects that I've worked on during the years.
View other projects that I've worked on during the years.
View other projects that I've worked on during the years.
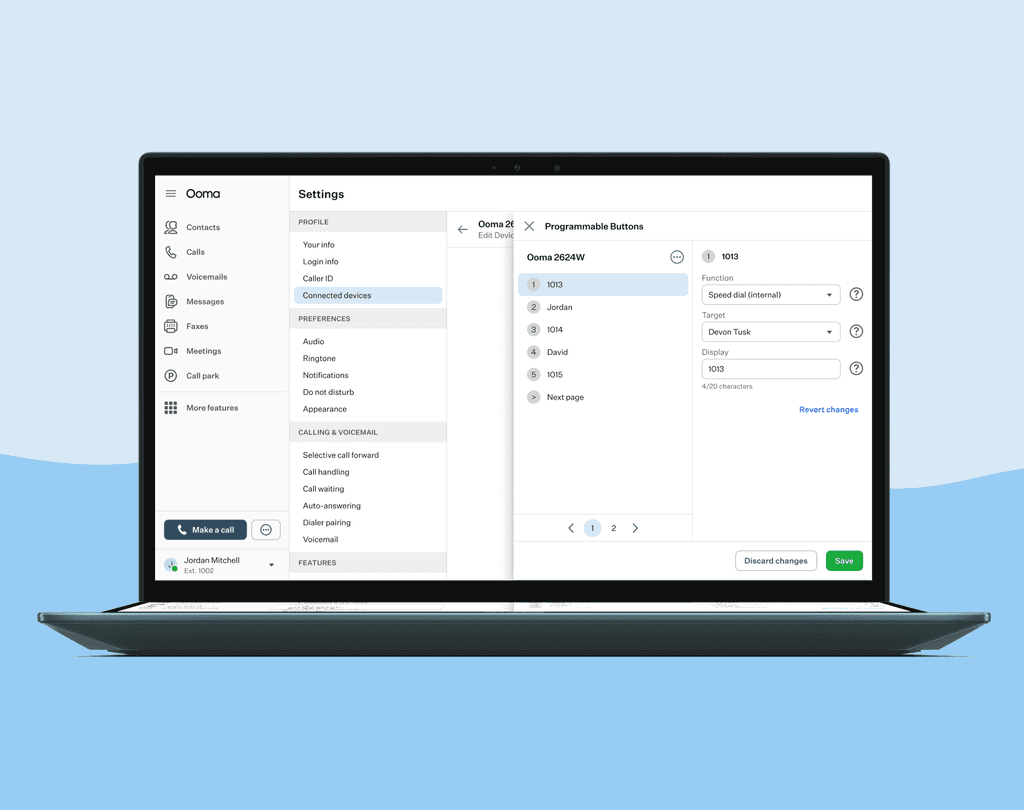
Configure Programmable Buttons in devices
Set your device to have different features depending on what you click.
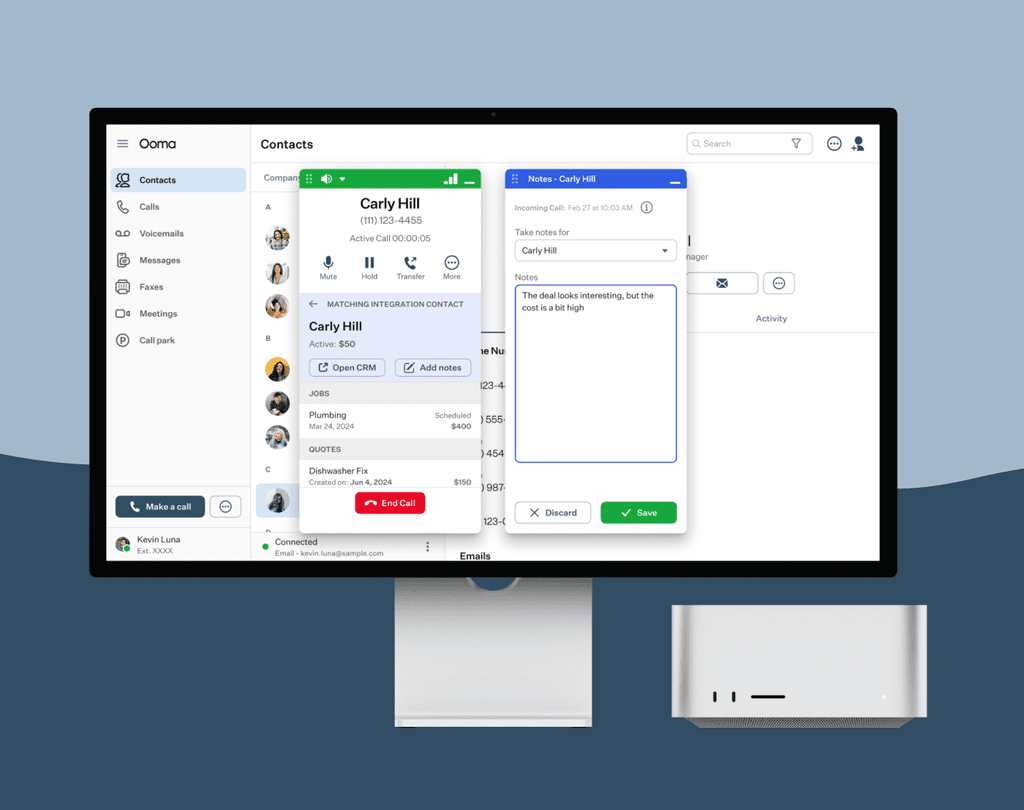
Add notes while taking calls
Connect with our different CRM Integrations and take notes of conversations with your client.
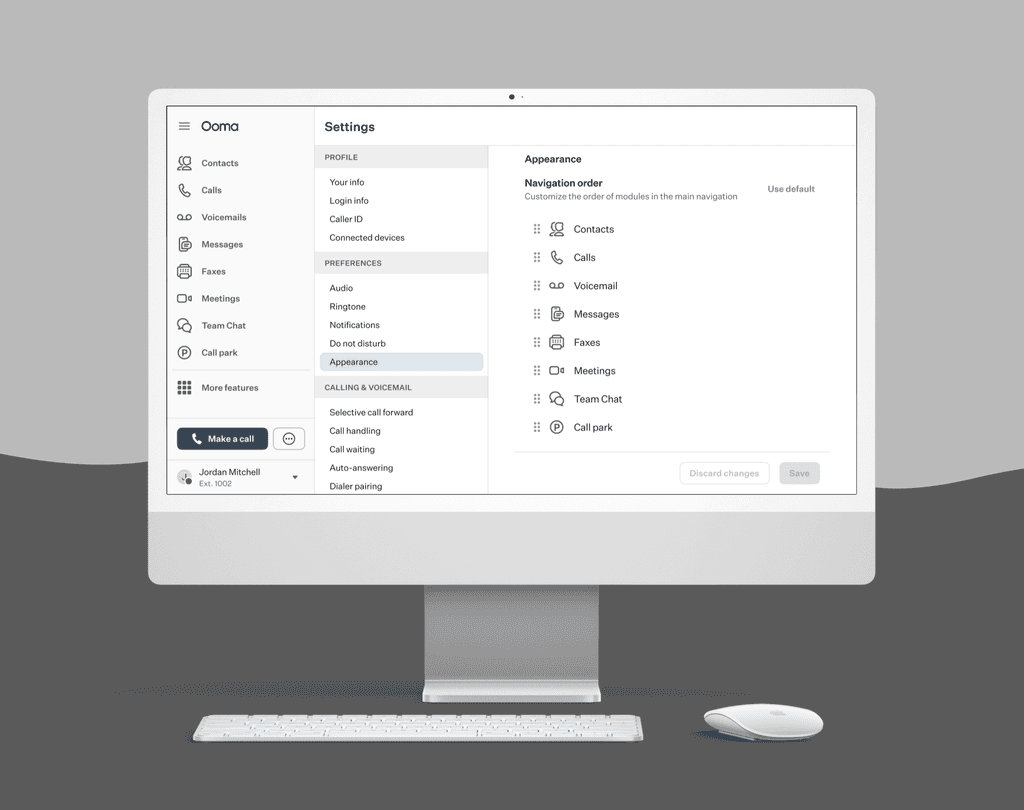
Customizing navigation in menu
Set your menu navigation the way you prefer and have easier access to your favorite features.